115
MU Series (Windows)
User’s Manual
Process Menu Tools
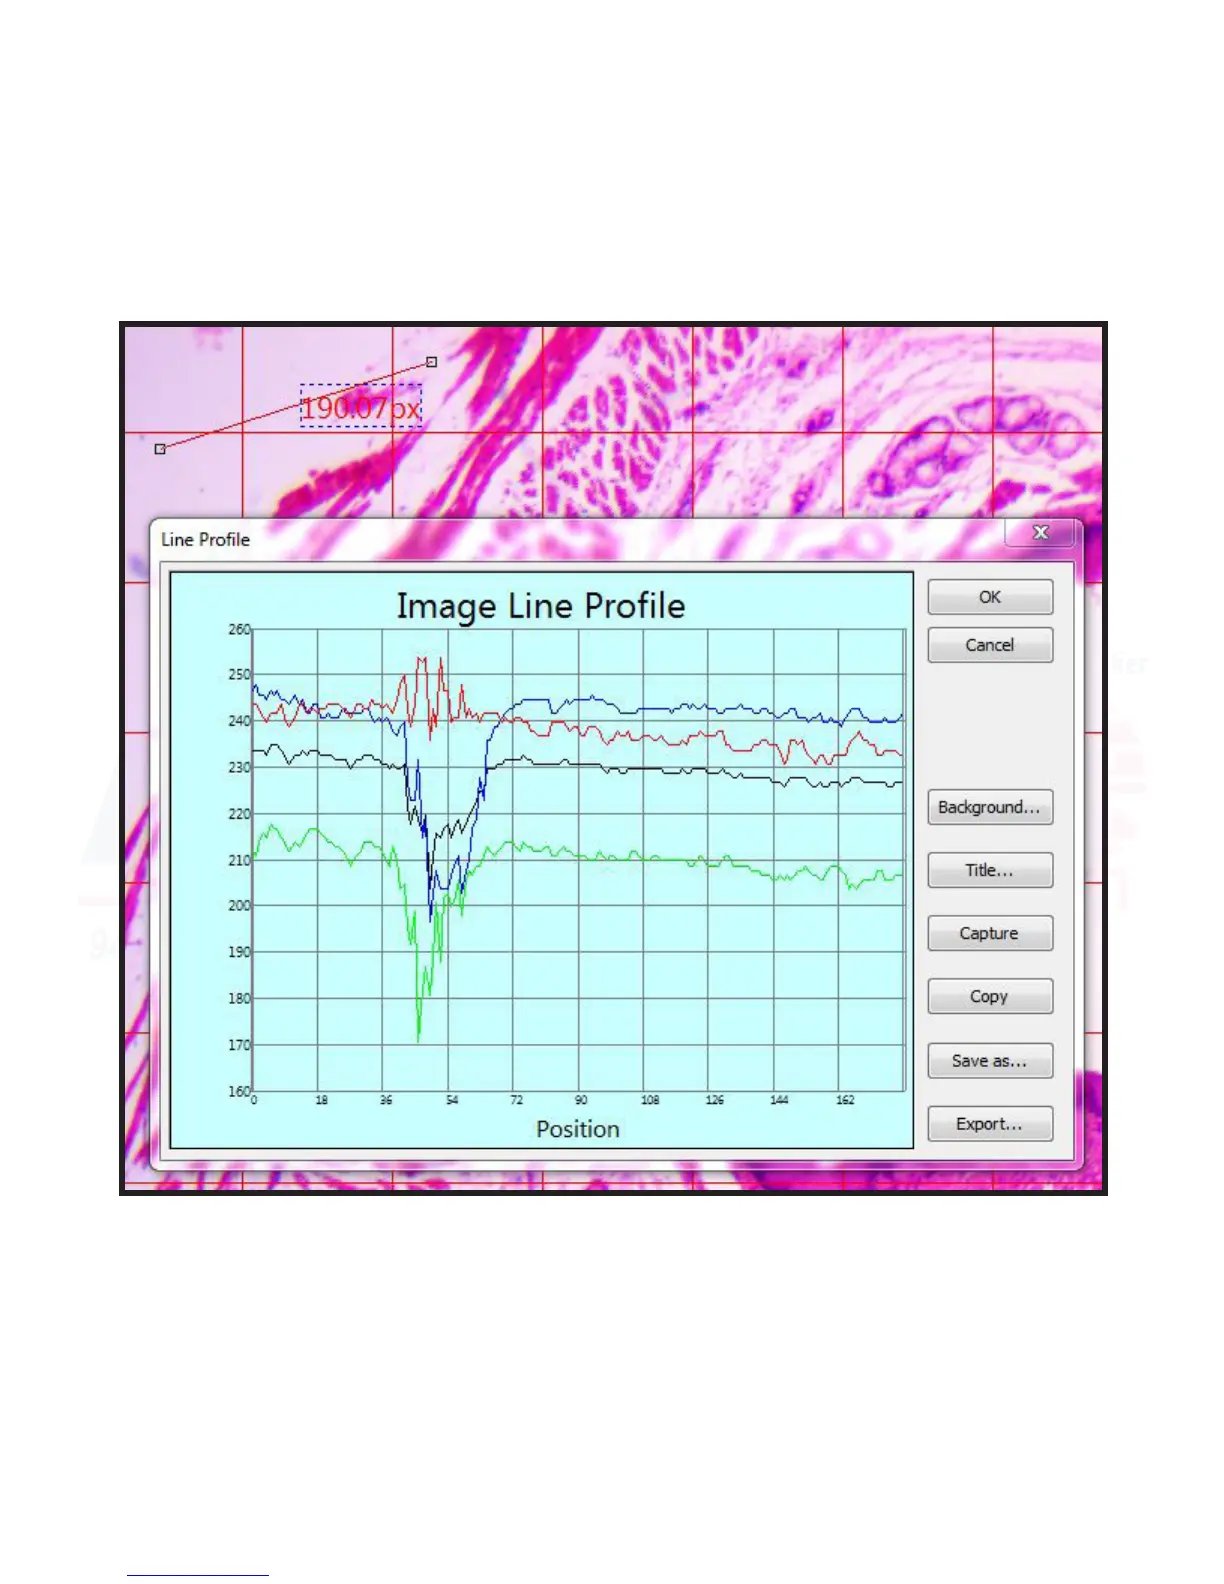
Line Prole
Below shows an example of the image line prole tool in use, where each color and intensity is individually
graphed.
In the above line prole, the X-axis represents the spaal scale of the line, and the Y-axis represents intensity
values ranging from 0 to 255. A gray scale image will provide a gray value instead of RGB (red, green, blue) his-
togram. If the image is an HSV image, RGB will be replaced with HSV (hue, saturaon, value).
The “Background” buon opens the window color dialog box to allow you to adjust what colors are considered
the background, and which are considered for the line prole.