117
MU Series (Windows)
User’s Manual
Process Menu Tools
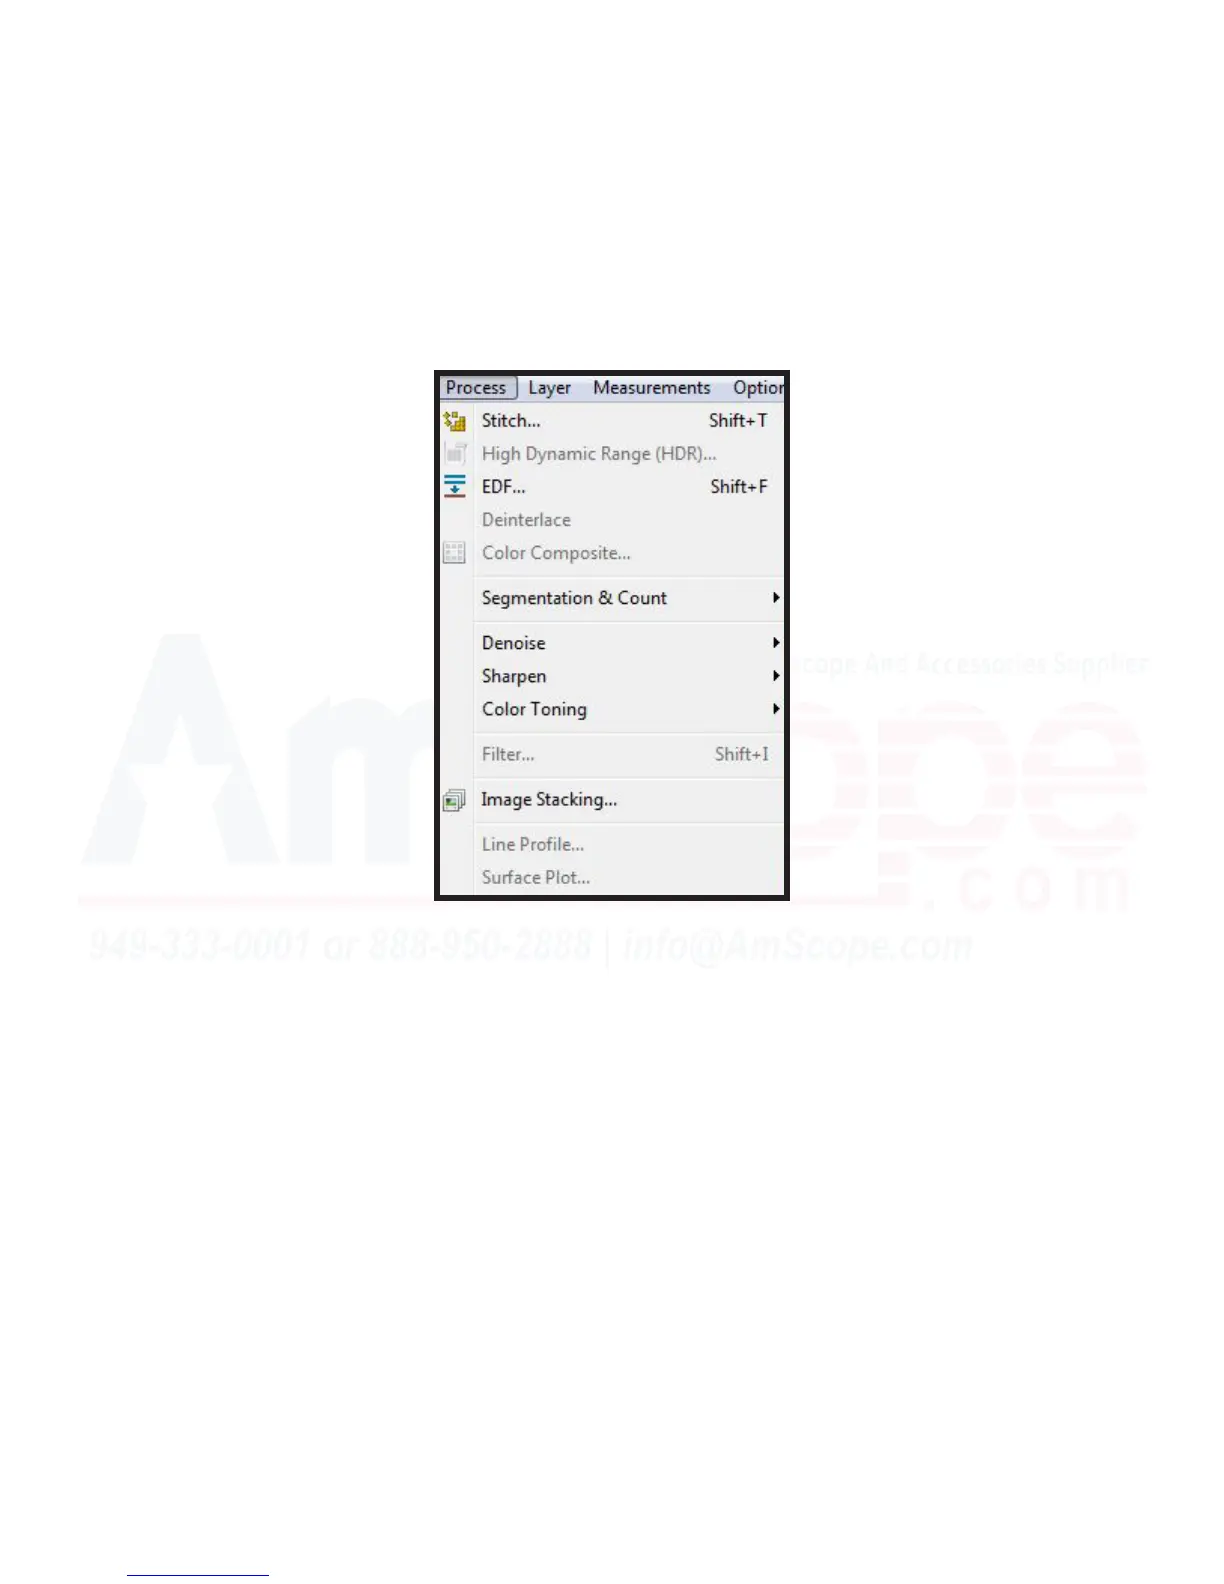
Surface Plot
The “Surface Plot” funcon generates a three dimensional representaon of the intensity of an image, much
like the “Line Plot” funcon, however, over an enre image. This is performed by considering the X (image
width), Y (image height), and Z (pixel gray value) variables. The more intense (higher grey value) a pixel, the
taller it is on the topographical mapping of the image, while X and Y refer to the posion of the pixel.
1. Begin using a captured image, and click “Process” and “Surface Plot...” to open the 3-D Setup menu. The
soware will render a three dimensional sculpture of the image’s topography based on pixel intensity (gray
value), and allow you to modify several parameters to create the best result for your specic sample.