Chapter 3 Measurement
3-54
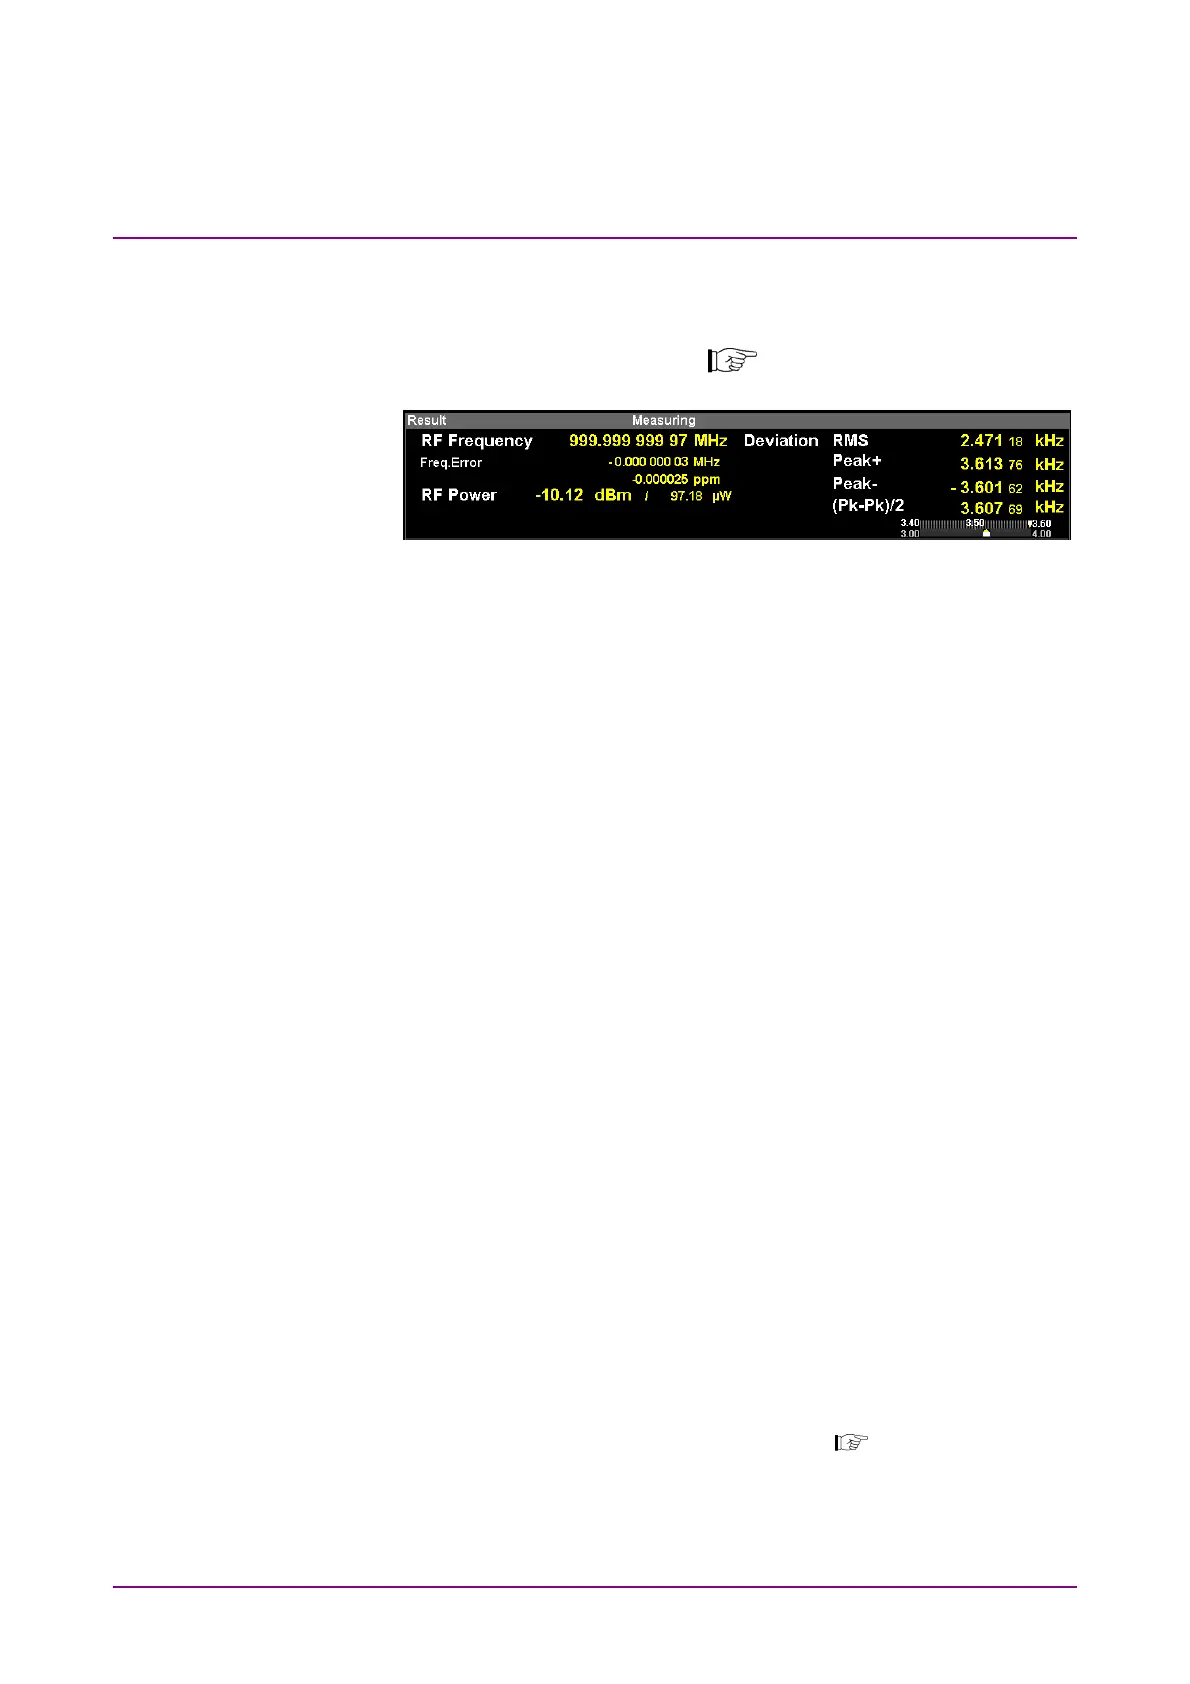
3.4.9 Display result
The Result window displays analysis result of RF signal.
Figure 3.2.1.1-1 TX Mode Screen
Figure 3.4.9-1 Result Window (For FM Modulation)
RF Frequency
■
Summary
Displays the difference [MHz and ppm] of the carrier frequency of
measured signal [MHz] and the frequency setting value of TX
Frequency. [MHz]
It is not displayed when Display Mode is Modulation.
RF Power
■
Summary
Displays the power result of measured signal in dBm and W units.
It is not displayed when Display Mode is Modulation.
Deviation
■
Summary
Displayed when Modulation is set to FM or Wide FM.
Displays the +Peak, –Peak, (+Peak to –Peak)/2, and RMS result of
frequency deviation of measured signal in Hz unit.
Displays the Average and Max. Hold results when Average is set to
ON.
It is not displayed when Display Mode is Carrier.
Meter Display
■
Summary
Displays the result of the measurement signal frequency deviation
on the meter.
Displayed when Modulation is set to FM or Wide FM.
It is not displayed when Display Mode is Carrier or Modulation.
3.4.3.2 “Setting Meter”