Using IQC5000 with IQC Control
44
Progress Bar
The progress bar is located near the top of the IQC5000 Management section. It displays the state of the IQC5000 –
such as Idle when it is not performing any action – and the progress of the current operation (such as record,
playback, or erase). In certain situations, such as for recordings waiting for a stop trigger, the progress bar will show
that it is recording with no respect to time. Manual recordings show the progress in respect to how much memory
is left.
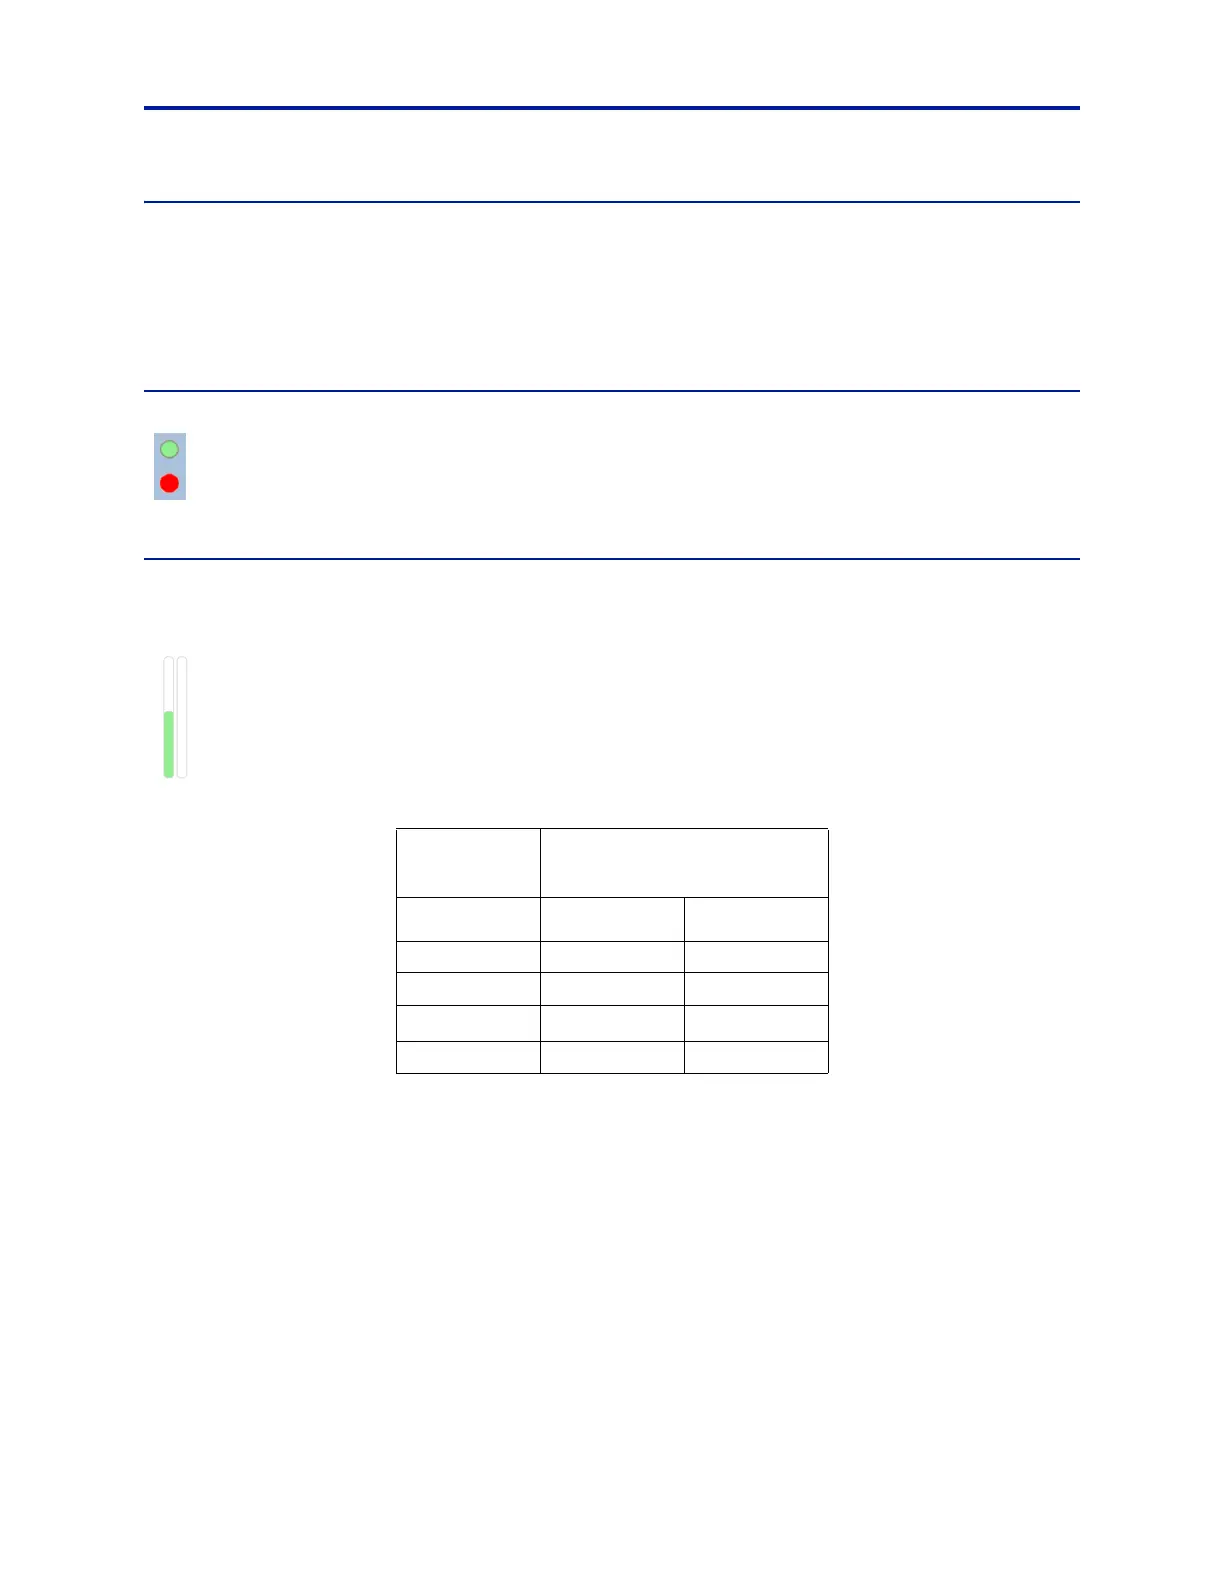
Indicators
The IQC5000 system takes on the role of a hub for many signals and operations, and for this reason,
indicators are used heavily within the user interface. Simple cir
cles that light green or red indicate the
presence or the readiness of a specific component. The Recording Channel indicators are unique and are
covered in "Channel Selection" on page 54.
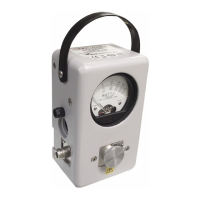
VU Meter
The VU Meter is located at the left side of the IQC5000 Management section. There are 2 bars – the left
corresponds to the Channel 1 recording, and the right to the Channel 2 recording.
The VU Meter graphically represents the maximum digitized value in relation to the dynamic range of the
digitizer. After the refresh time of 300ms, the VU Meter is upda
ted to reflect the maximum value detected
during that 300ms. This is a maximum value hold operation, rather than averaging the value.
It is important not to under-range or over-range (clip), but effe
ctively utilize the maximum dynamic range
of the digitizer. For example, the importance is the same as recording a human voice with a microphone at
a gain level suited for a whisper, or for shouting, depending on the expected performance’s volume level.
Table 22 - VU Meter Color Gradient
Percentage of Digitizer
Max Value
Color Linear Logarithmic
Red 85.1 - 100% 97.6 - 100%
Orange 75.1 - 85% 93.6 - 97.5%
Yellow
65.1 - 75%
90.1 - 93.5%
Green 0 - 65% 0 - 90%
There are two modes – linear and logarithmic – selectable by right-clicking the VU Meter. Linear mode displays the
ratio of the digitized value to the dynamic range of the digitizer in bits, linearly. Logarithmic mode displays the
maximum value in terms of power, logarithmically.
Ideally, the recording should be made as close to the maximum le
v
el as possible, considering the possible change in
signal amplitude that may result in over-ranging. Therefore, it is recommended that the recording be made as close
to the linear 85% level, where the VU Meter changes from orange to red. If a known signal of constant amplitude is
being recorded, this level can be pushed further to the 90 - 95% level.
The maximum value detected during
a recording is saved to the recording’s header file.