5-20
Chadwick-Helmuth Company, Inc.
Chapter 5
- Balance Measurement and Solutions
balance frequency, the vibration amplitude, and the clock angle. Plot the amplitude and clock angle on
the appropriate paper chart from Chadwick-Helmuth and follow any instructions given there for
determining the correct solution.
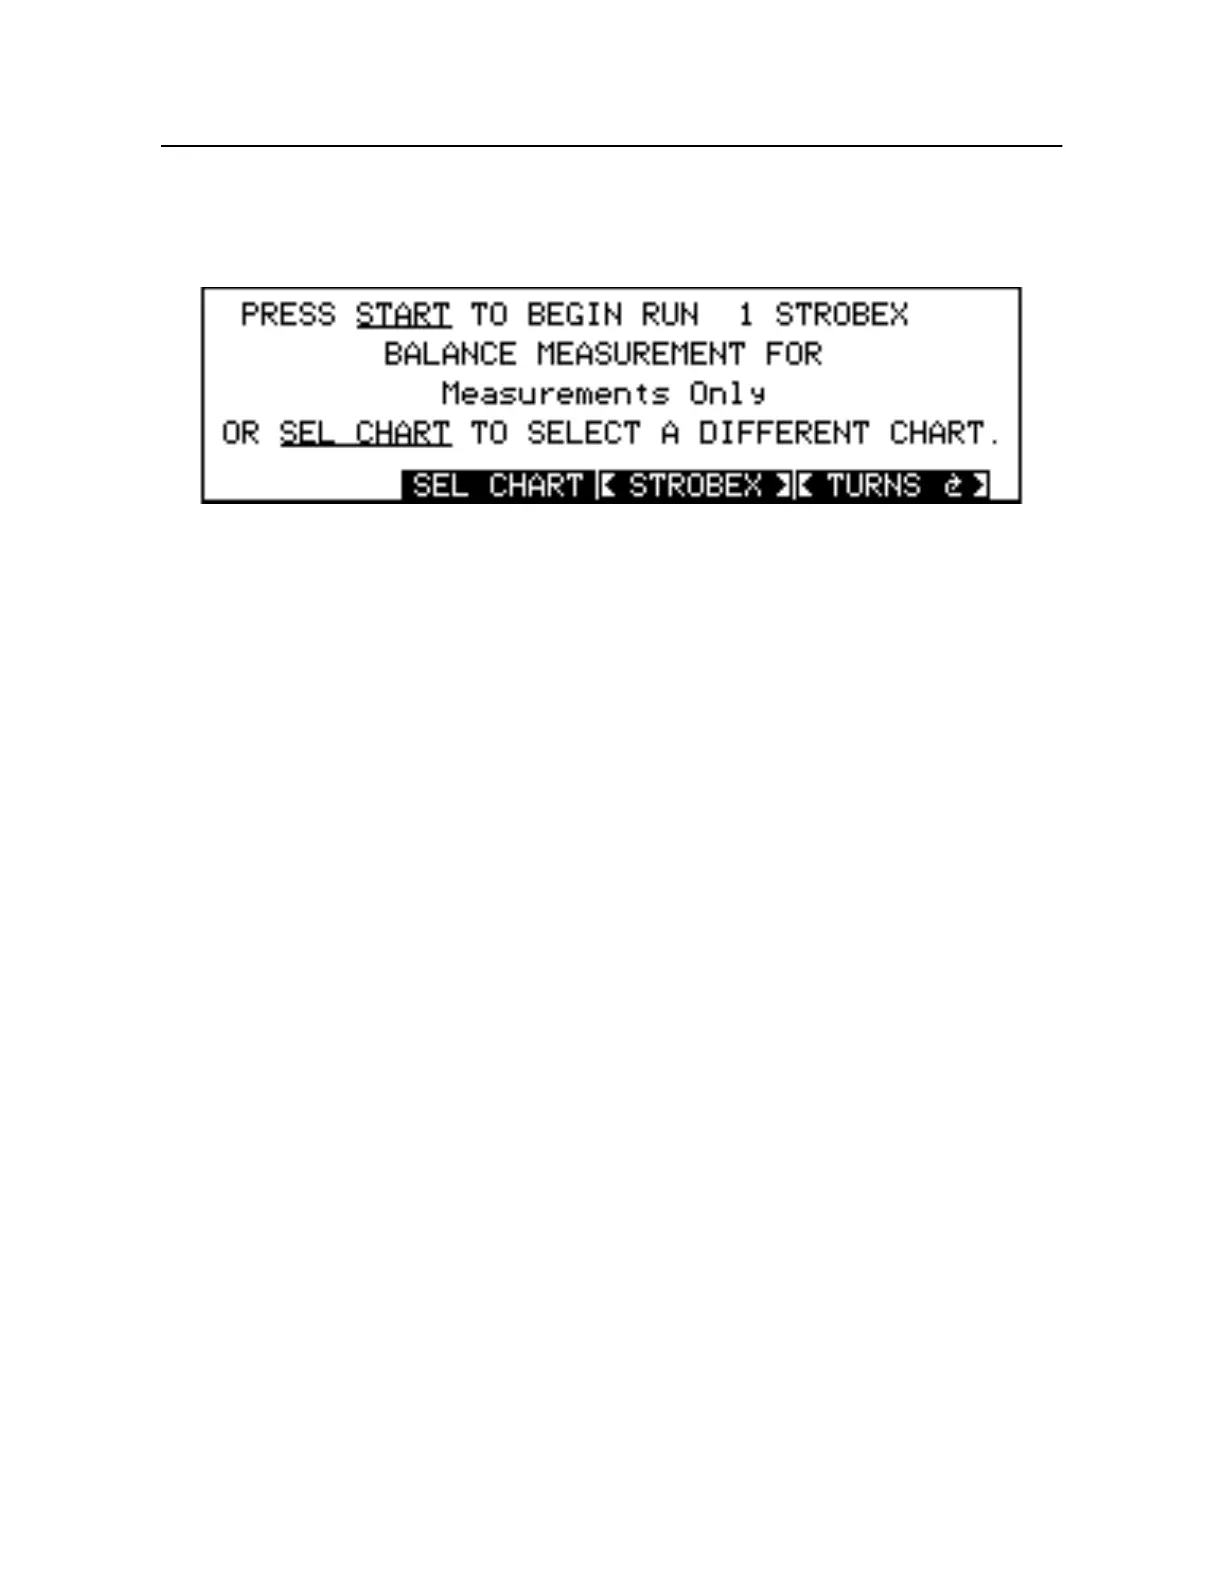
Figure 5-18. Measurements Only/Strobex Balance Start-up Screen
5.6.3.2 Paper Chart Creation
To create a new balance chart, use the Measurements Only chart to plot the vibration amplitude and
clock angle of the system on the clock face of a Universal Balance Chart Worksheet. Repeat th
measurement with a precise amount of weight added to one of the system's balance points. As you
move the weight around to each of the balance points and repeat the procedure using different weight
amounts, you can extrapolate the orientation and calibration of the superimposed graph. The geometry
of the graph has already been determined by the number of blades and the relative position of the
balance points.
5.6.3.3 Paper Chart Correction
The accuracy of a new chart is biased by any inherent out-of-balance conditions that might have
existed before the chart was created. The technique of chart correction removes these biases, as well as
those that may be otherwise due to the unique physical characteristics of the aircraft. Se e Section5.6.2
“Chart Corrections” on pa ge5-17 for more details on chart corrections.
Chart corrections compare the actual effects of weight on vibration amplitude and clock angle against
the changes predicted by the chart. We can quantify the comparison by means of a move line
calculation. The difference between the observed direction and the expected direction indicates the
amount of phase angle correction that must be applied to subsequent measurements. This action is
usually accomplished by rotating the clock face or writing new clock numbers around the chart.
The magnitude (length) of the move line signifies a particular vibration level or amplitude. The length
of the move line is directly related to the size of the weight adjustment, and the ratio of the observed
magnitude to the expected magnitude indicates the percentage weight correction that must be applied
to subsequent measurements. For example, if the move line is too long, too much weight has been
added, but if it is too short, not enough weight has been used.
For more information about paper charts, the Chadwick-Helmuth publication “The Polar Coordinat
Chart: Balance Chart Making in the Real World” contains an overview of balancing with paper charts.