7-2
Chadwick-Helmuth Company, Inc.
Chapter 7
- Spectrum Analysis
7.2 Data Acquisition and Storage
This section explains how to operate the 8500C/C+ in Spectrum mode for the purpose of collecting and
storing spectral data.
7.2.1 Spectral Frequency Plots
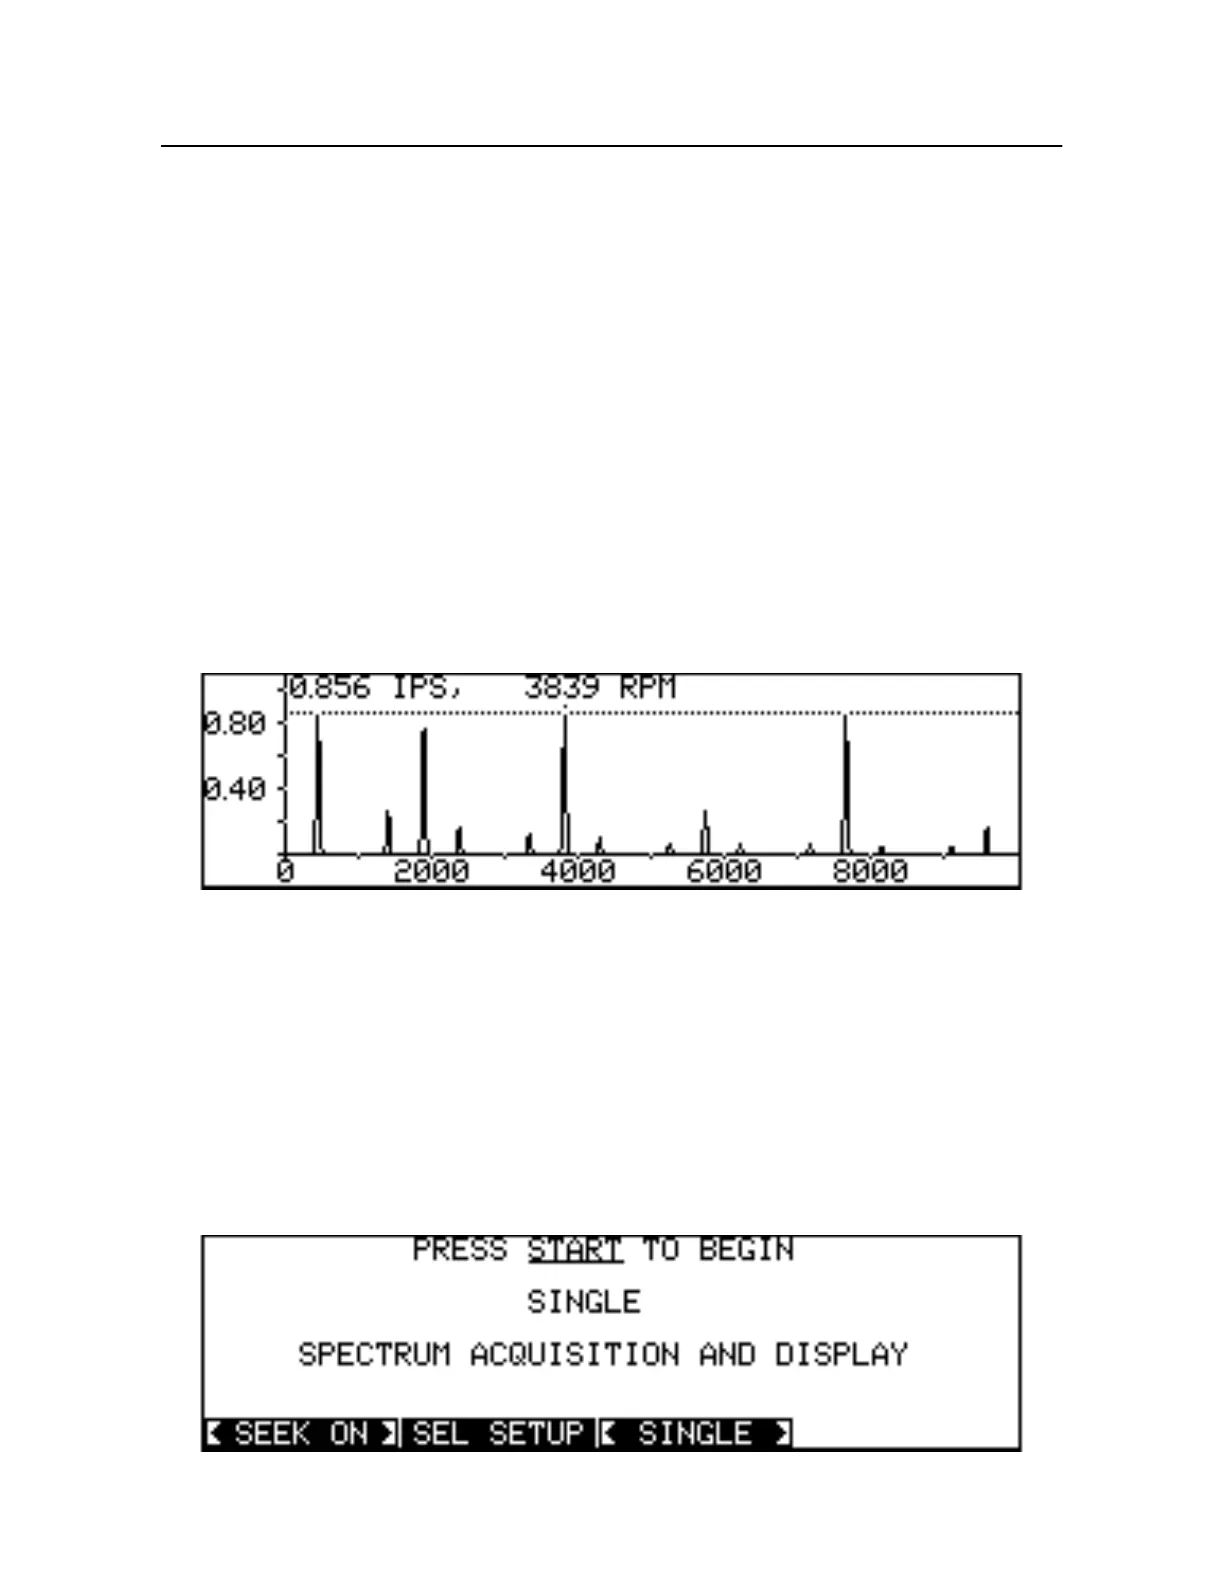
Once the spectral data set has been collected, it is immediately displayed as a fast Fourier transform
(FFT) spectral-frequency plot, with frequency displayed along the horizontal X-axis in revolutions per
minute (RPM) or Hertz (depending on the units selected), and vibration amplitude displayed along th
vertical Y-axis in inches per second (IPS). A special cross-hair cursor, highlighting the intersection of
frequency and amplitude on the spectral plot, may be moved left or right with th e Arrowkeys (se
Figur e7-1). If the seek peak function has been enabled (using
SE EKON
), the cursor jumps from one
spectral peak to another, subject to the value of the seek amplitude threshold. Note that in seek peak
mode, the cursor cannot be moved if no peaks exceed the seek amplitude level. Otherwise, if seek peak
has been disabled, the cursor has an unrestricted range across the frequency axis. In both cases, th
current cursor position is always shown in numerical form at the top left of the graph.
Figure 7-1. Spectral Frequency Plot
7.2.2 Aborting Data Acquisition
A data acquisition in progress may be aborted by pressing the
START
key. If
STOP
is pressed while
the 8500C/C+ is in single mode, all existing spectral data becomes lost. In this case, a spectral
frequency plot cannot be generated. Instead, a special Start-up screen is displayed with two soft
function keys, the repetition mode and seek mode keys (see Sec tion7.3.1.5 “Repetition Mode” on
page 7-4 and Sect ion7.4.3 “List Peaks Function” on pa ge7-8). The
SEL SETUP
key is available if
you wish to modify any of the spectrum parameters before initiating a new data acquisition (see
Figur e7-2).
Figure 7-2. Spectrum Start-up Screen