Xtium-CL MX4 User's Manual Appendix B: Troubleshooting Installation Problems • 123
Troubleshooting Procedures
The following sections provide information and solutions to possible Xtium-CL MX4 installation and
functional problems. The previous section of this manual summarizes these topics.
Diagnostic Tool Overview
The Xtium-CL MX4 Board Diagnostic Tool provides a quick method to see board status and health.
It additionally provides live monitoring of FPGA temperature and voltages, which may help in
identifying problems.
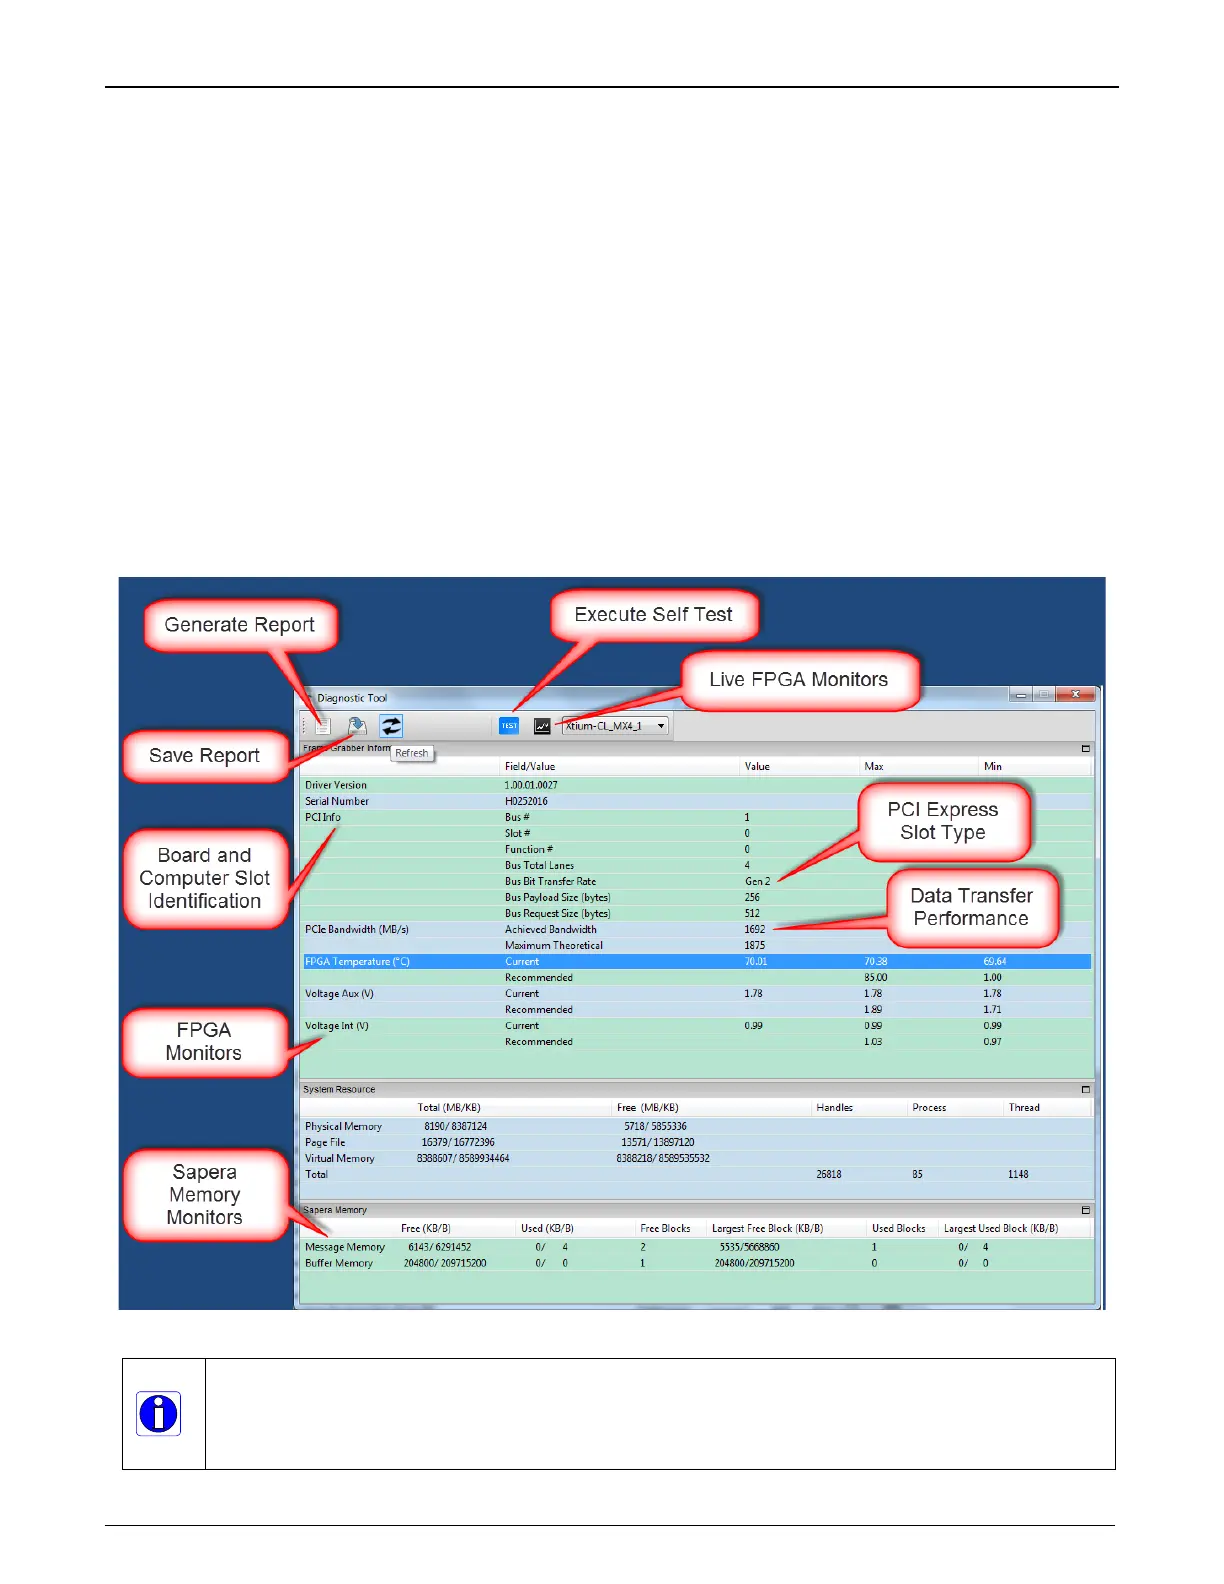
Diagnostic Tool Main Window
The main window provides a comprehensive view of the installed Xtium board. Toolbar buttons
execute the board self test function and open a FPGA live status window.
Important parameters include the PCI Express bus transfer supported by the host computer and
the internal Xtium FPGA temperature. The bus transfer defines the maximum data rate possible in
the computer, while an excessive FPGA temperature may explain erratic acquisitions due to poor
computer ventilation.
Figure 44: Diagnostic Tool Main Window
Note: when the Xtium-CL MX4 firmware is configured for dual acquisition (2 x Base
Camera Link), the PCIe bus transfer is divided equally between the two inputs. The
Diagnostic Tool displays the PCIe bandwidth statistics for one input (for example, the
total maximum bandwidth for each input is half the PCIe bus capability).