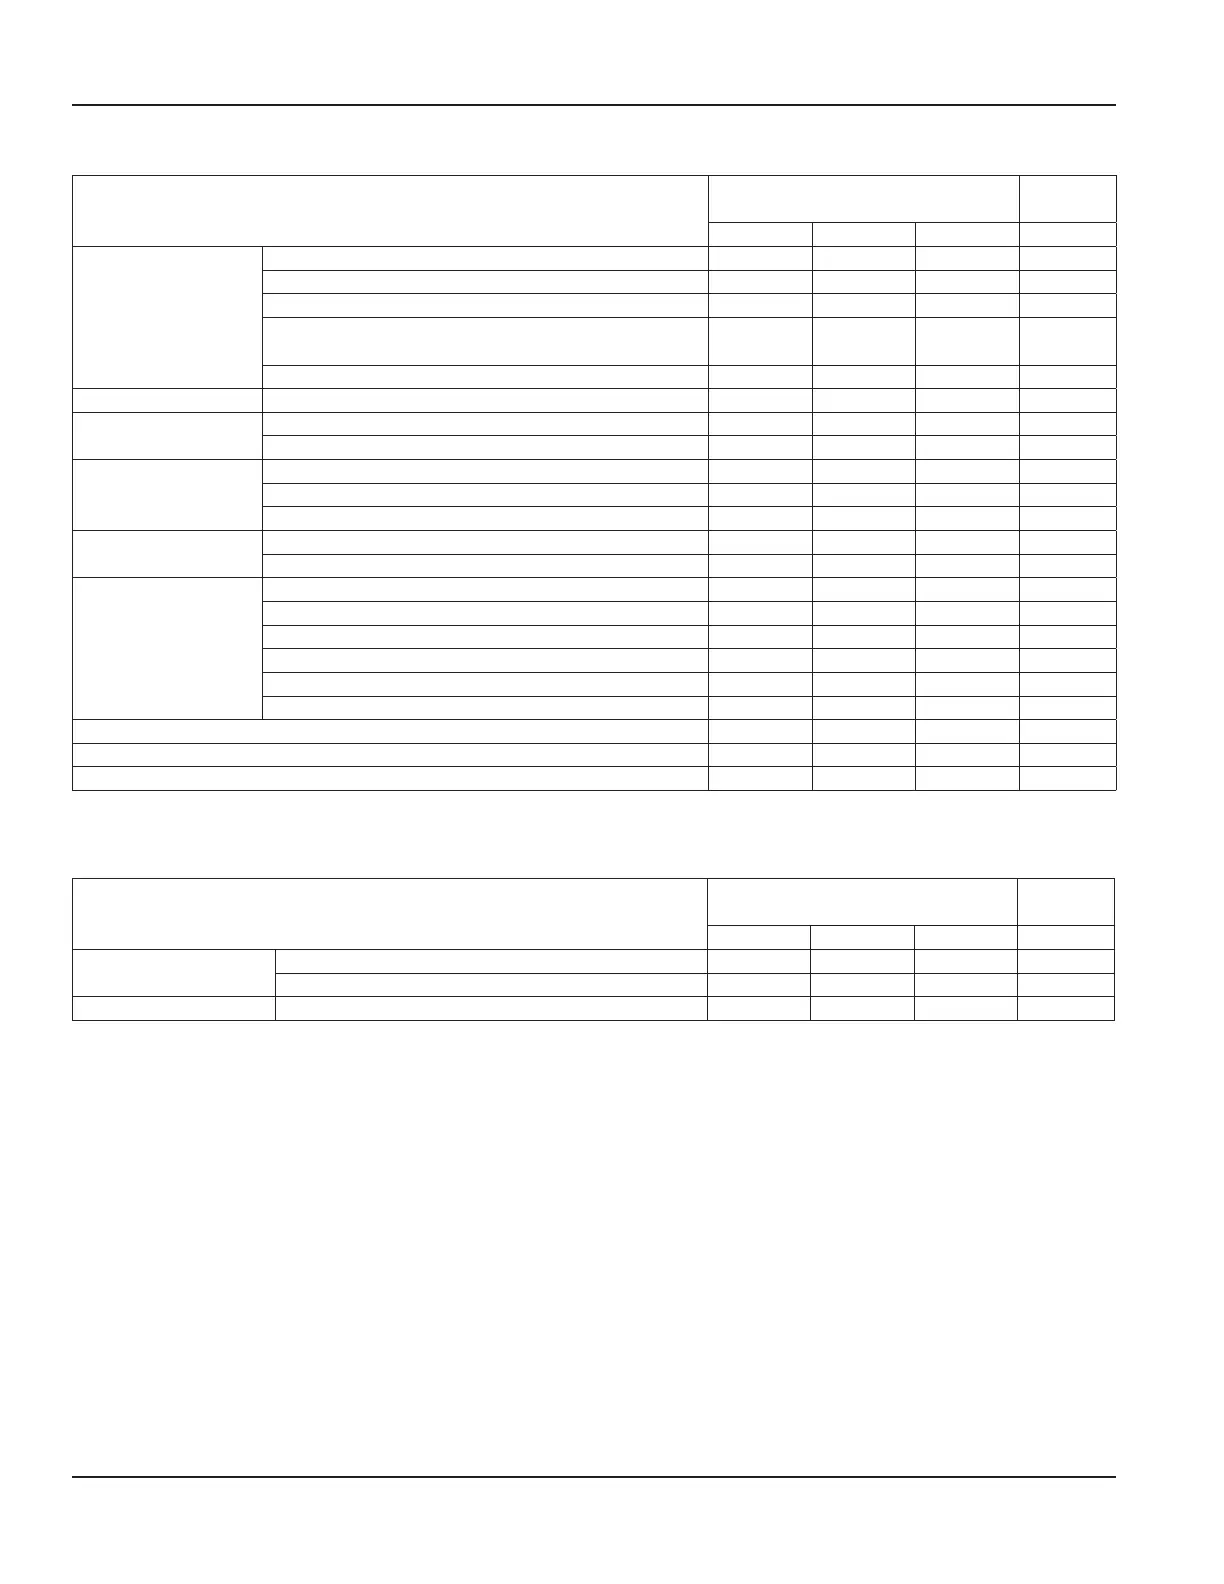
11.1.2. Closed Conduit, Partly Full Non-Metal Pipes
Material
Manning Coeff.
Strickler
Coeff.
n min n Norm n max kst
1. Synthetics/ plastics a. Acrylic 0.008 0.009 0.010 111
b. Polyethylene (PE) 0.008 0.009 0.011 111
c. Corrugated Polyethylene Culvert Pipe (smooth) 0.009 0.013 0.015 77
d. Corrugated Polyethylene Culvert Pipe
(corrugated)
0.018 0.023 0.025 43
e. Polyvinyl chloride (PVC) 0.009 0.010 0.011 100
2. Glass — 0.009 0.010 0.013 100
3. Wood a. Stave 0.010 0.012 0.014 83
b. Laminated, treated 0.015 0.017 0.020 59
4. Clay a. Common drainage tile 0.011 0.013 0.017 77
b. Vitrified sewer 0.011 0.014 0.017 71
c. Vitrified sewer with manholes, inlets, etc. 0.013 0.015 0.017 67
5. Brick a. Glazed 0.011 0.013 0.015 77
b. Lined with cement 0.012 0.015 0.017 67
6. Concrete a. Culvert, straight and free of debris 0.010 0.011 0.013 100
b. Culvert with bends, connections and some debris 0.011 0.013 0.017 77
c. Sewer with manholes, inlet, etc., straight 0.013 0.015 0.017 67
d. Unfinished, steel form 0.012 0.013 0.014 83
e. Unfinished, smooth wood form 0.012 0.014 0.016 83
f. Unfinished, rough wood form 0.015 0.017 0.020 59
7. Sanitary sewers coated with sewage slimes 0.012 0.013 0.016 77
8. Paved invert, sewer, smooth bottom 0.016 0.019 0.020 53
9. Rubble masonry, cemented 0.018 0.025 0.030 40
Table 3: Specific roughness coefficients (Manning & Strickler coefficients) for closed conduit, partly full non-metal pipesl
11.1.3. Lined or Built-Up Metal Channels
Material
Manning Coeff.
Strickler
Coeff.
n min n Norm n max kst
1. Smooth steel surface a. Painted 0.011 0.012 0.014 83
b. Unpainted 0.012 0.013 0.017 77
2. Corrugated — 0.021 0.025 0.030 40
Table 4: Specific roughness coefficients (Manning & Strickler coefficients) for lined or built-up metal channels
Annex
Page 110 March 2021HYB-UM-03155-EN-03
 Loading...