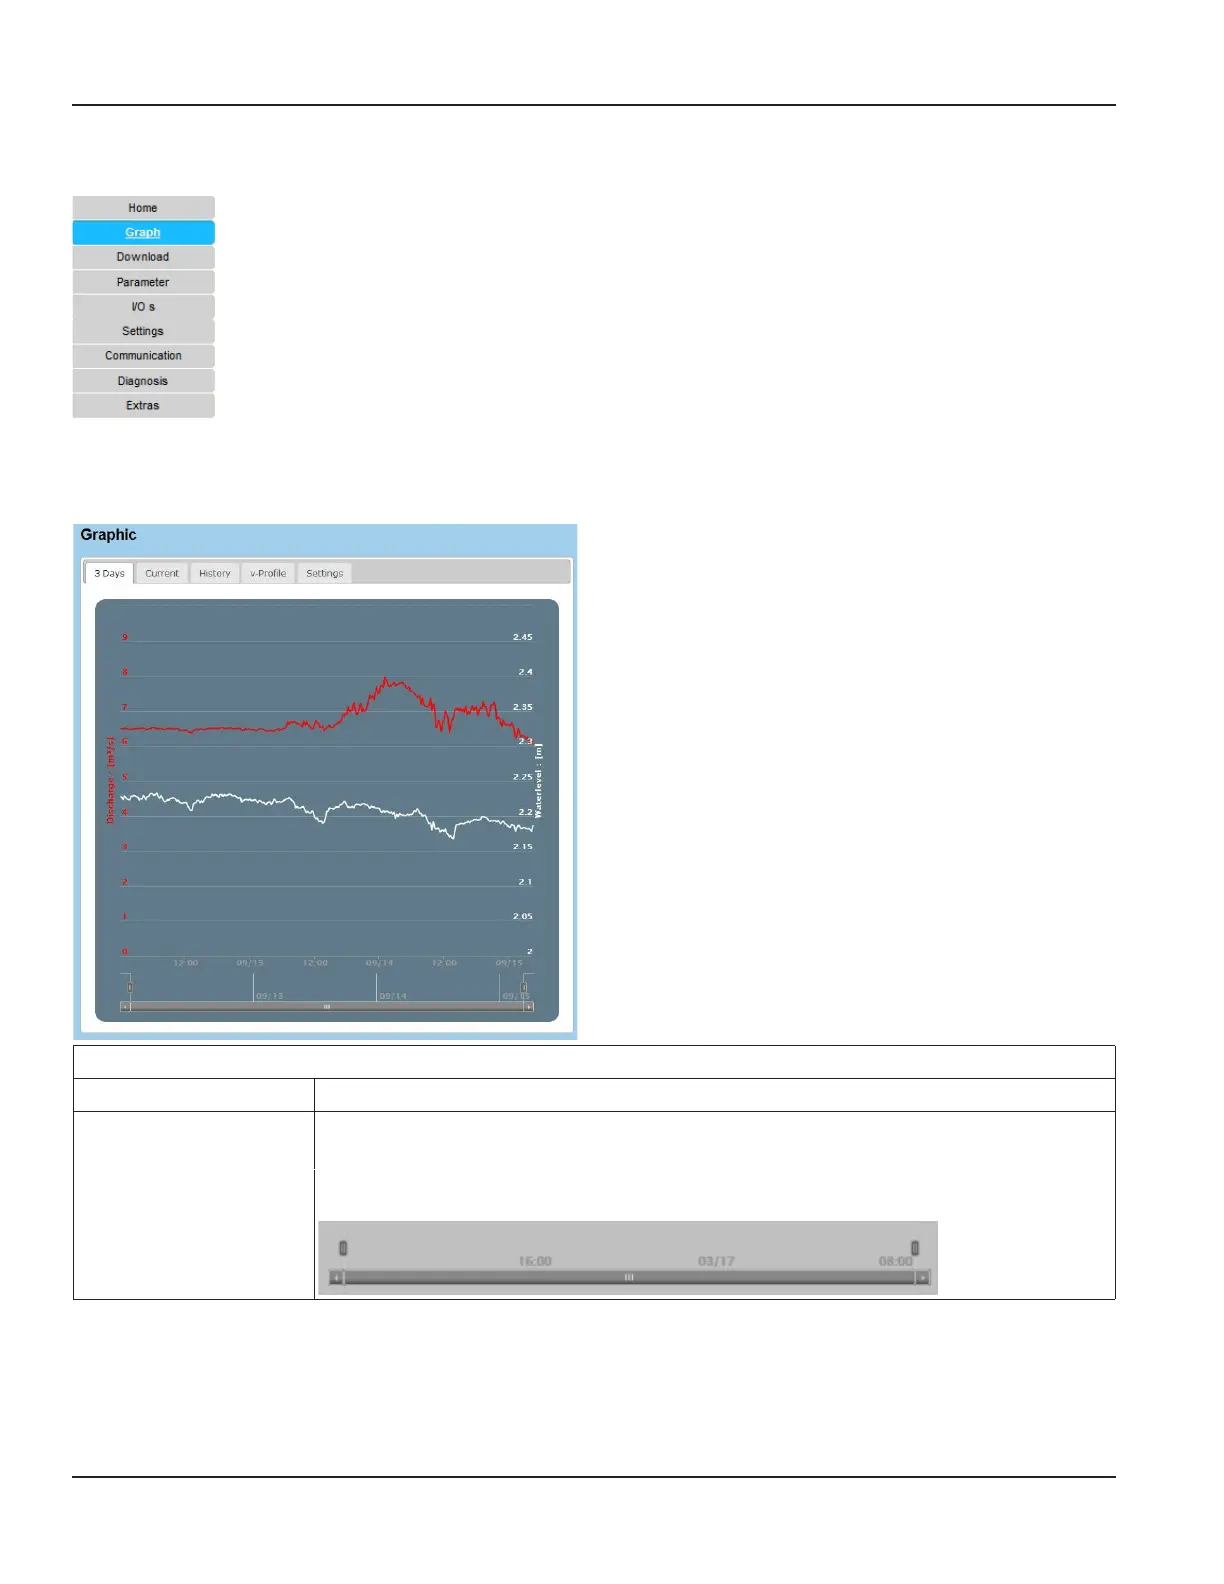
7.5. Graph - Data Visualization
Graph
3 Days Current History v-Profile Settings
This menu consists of 5 functions and provides flexible options for graphical display of data, for example
• online data presentation (Current)
• data point information by clicking directly on data curve
• data display over a user defined time period, data history (3 Days, History)
• velocity profile (v-Profile)
• customized parameters, color selection and scaling (Settings)
7.5.1. Three-Day Display
Display time series over max. 3 days.
3 Days
Setting Description
3 Days
Data display of last 3 days.
Click on single data point for display of measurement value.
Adjustable time bar Select time span by adjusting the time bar; click with left mouse button on the end of the bar,
hold down the left mouse button and drag bar in position for desired date
Programming
Page 34 March 2021HYB-UM-03155-EN-03
 Loading...