2017.06.19 FwdMan2.8.17.docx 10-81
10.10 Monitoring the System’s Status
The program provides an interface that can be used to monitor the status of the FWD/HWD
systems including voltages, deflector drifts, and statistics regarding the number of tests
performed. These screens are accessed from the UUIUUnformation menu item in the data
collection screen. Three menu items are available in the list box: UUVUUoltages, UUDUUrift/Vibration,
and UUSUUtatistics.
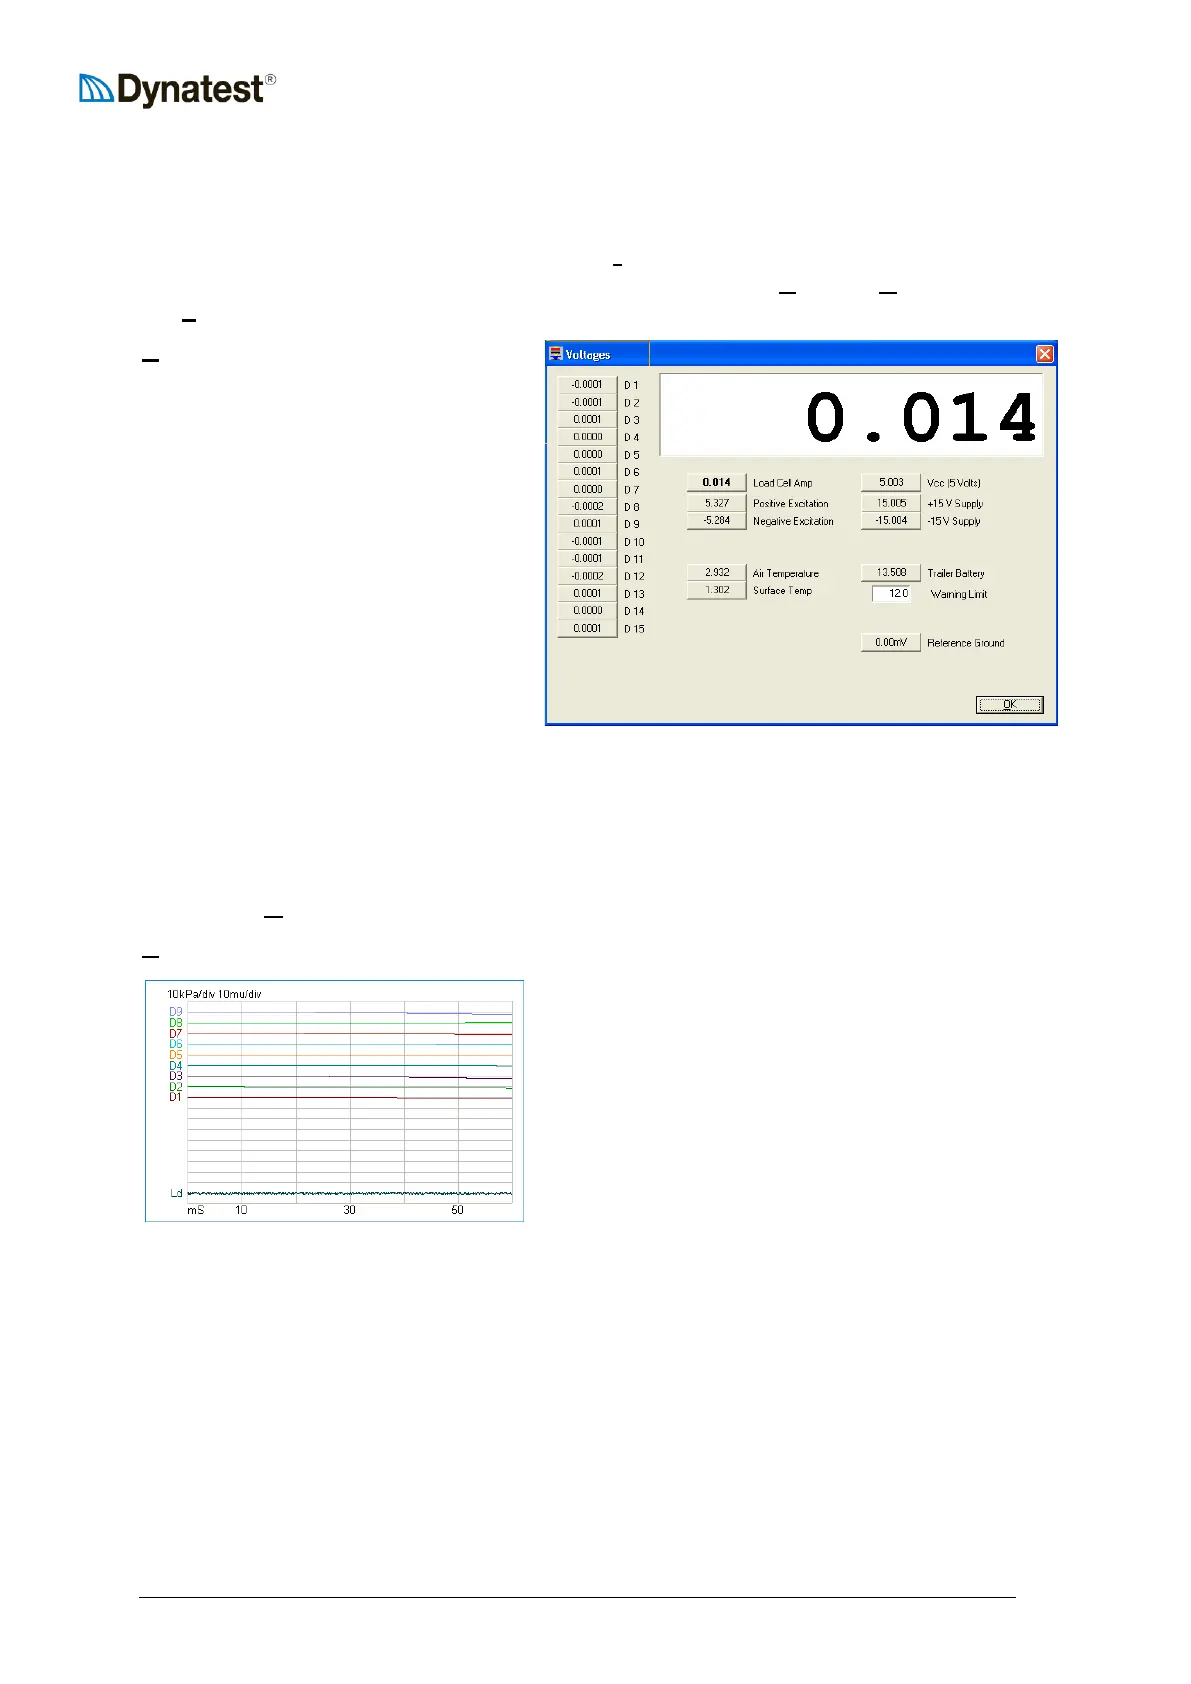
UUVUUoltages
The voltage screen is shown at right.
The list of voltages appearing along the
left side of this window corresponds to
the various deflectors. If a deflector is
stationary, the voltage should be very
close to zero. If the voltage is varying
with time, it either means the deflector
is experiencing vibration from some
source, or is defective.
Clicking on a button on this screen
causes the reading to be displayed on
the large readout at the top of the
screen as well as on the face of the
button. This aids in troubleshooting as the reading can be seen from some distance.
Where applicable the tool tip shows the typical voltage range for the component.
The “Warning Limit” sets the Trailer Battery threshold for warning the operator of low
voltage condition.
Pressing the UUOUUK button closes this screen and returns to the data collection window.
UUDUUrift/Vibration
Selecting this menu item will bring up a
continuously updating time-history plot of the load
cell and deflector outputs. This screen is used
mainly for troubleshooting suspected problems.
Time in milliseconds is plotted along the X-axis
while load and deflections are plotted for each
device on the Y-axis. Load reading is plotted with
positive in the “up” direction, while deflections are
plotted as positive downward.
Prior to activating the drift screen, the operator should lower the plate and deflectors to the
pavement surface. The pavement should be free of vibrations (due to traffic or other sources).
The base line for each transducer is adjacent to the respective label Ld, D1 … D9.
The Y axis scale for load and deflection is shown at the top of the plot. In this case, each
horizontal line represents and increases of 10 kPa of pressure for the load cell. Each
horizontal line represents 10 microns of deflection for the deflectors.
If the FWD/HWD is working properly, the lines should be fairly flat and coincident with the
each components base line. If one or more lines are tracking away from their origins, this is
indicative of a problem with the system.