For example, level of inventory is recorded for a specific product, at the same
warehouse, in the same year, on different dates. If you select Average and the
Degree of detail set for the column is Day, the identical records are summed
and then divided by the number of day categories in the month. However, if
you select Last period, the inventory value for the last day of the month is
shown.
v Duplicates rollup is automatically used whenever the PowerCube Consolidate
feature is turned on.
If you select both Regular rollup and Time state rollup, regular rollup is
performed first, followed by the time state rollup.
If the measure is used as a weighted value, as occurs during measure allocation,
you can use only the Sum rollup type.
When a model has more than one time dimension, you cannot use time state
rollup.
Set a Regular Rollup Function for Measures
By default, the values for a measure are automatically totalled using the Sum
function. Depending on the context, you may change this default rollup to
Minimum, Maximum, Average, Count, Count All, Any, or External.
For example, suppose your sales analysis model contains a measure named QTY.
You want your OLAP reports to show the average monthly quantity sold for each
store. You use Regular rollup (the Average function) to obtain the correct result.
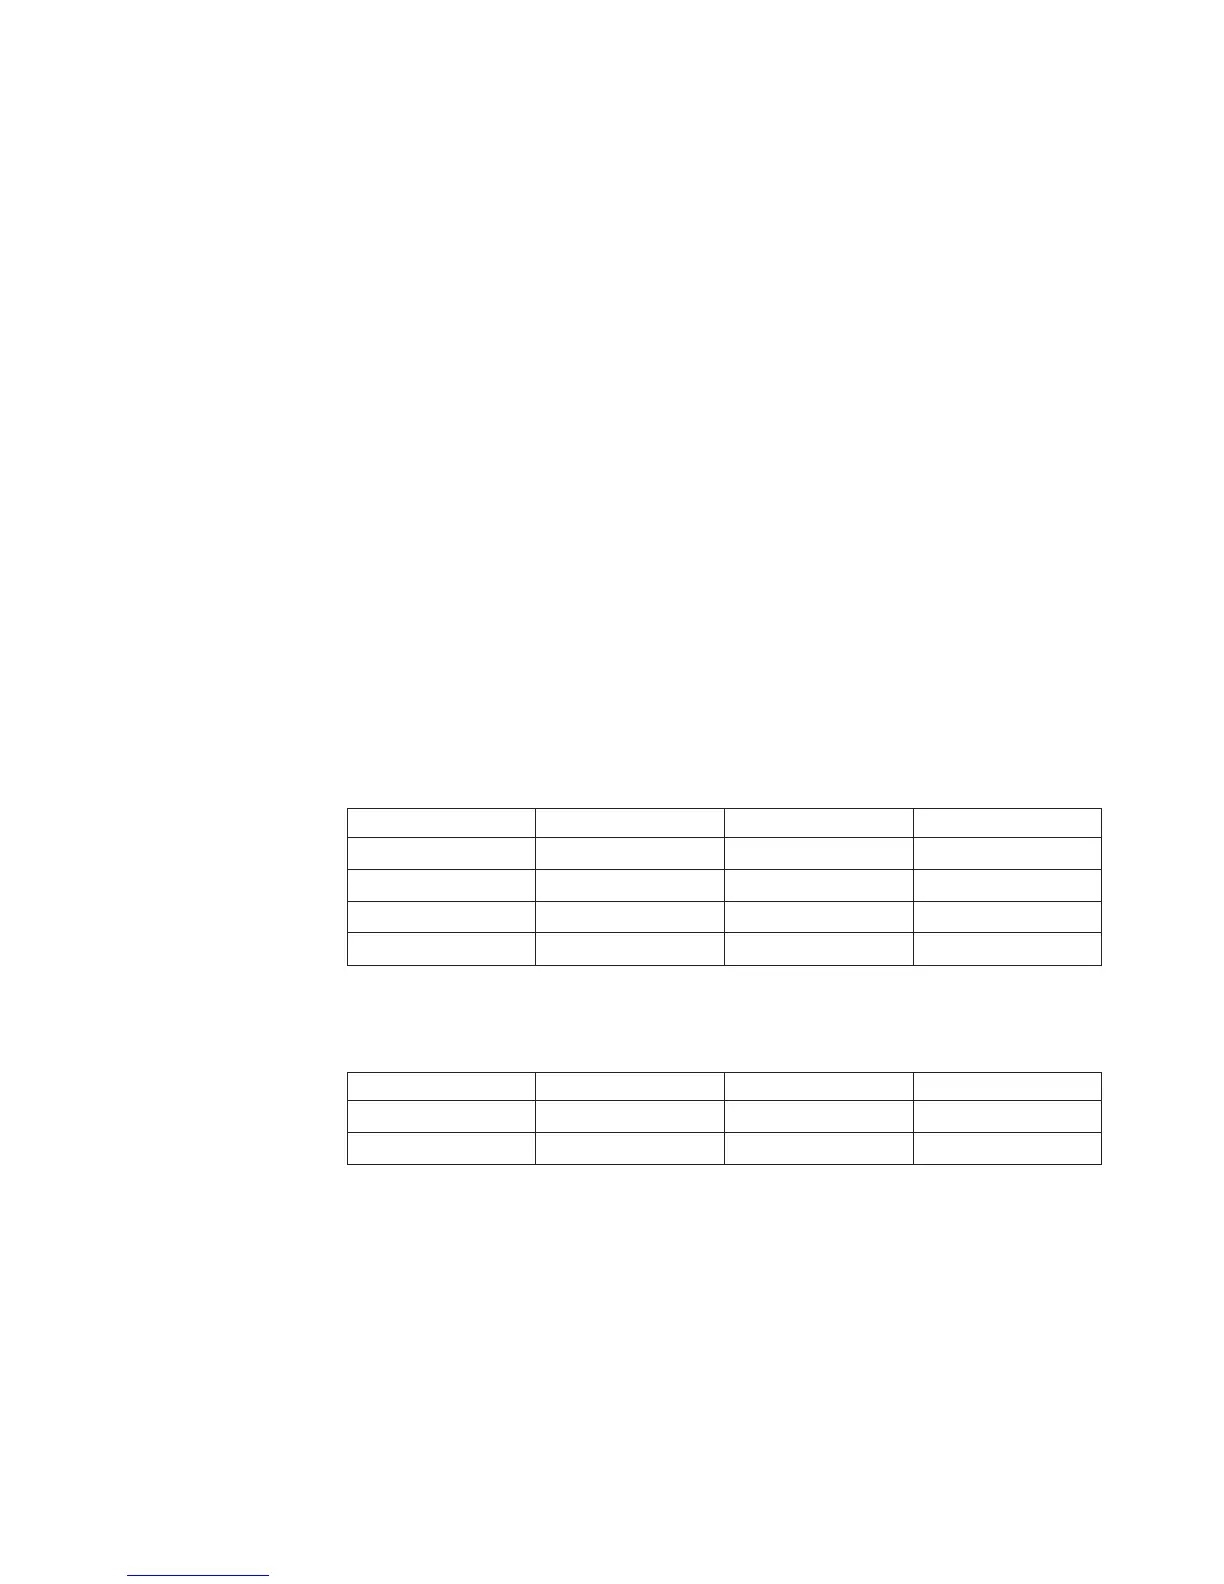
Your source data is as follows.
Date Store Product QTY
20070101 STORE1 TR139SQ 500
20070131 STORE1 TR139SQ 200
20070101 STORE2 TR139SQ 400
20070131 STORE2 TR139SQ 600
After applying the Average rollup function, the following results appear in your
report.
Date STORE1 STORE2 STORE
2007 350 500 425
Date 350 500 425
Calculated measures can be computed after rollup or before rollup. When the
measures are calculated before rollup, the values are those calculated in the data
source.
For the time dimension, when you select Average as your regular rollup type, the
records are first summed and the result is then divided by the number of records
in the rollup time period.
The formula for a first-quarter average involving 78 records can be represented as
follows:
Chapter 5. Modeling Your Key Performance Measures 101