INFICON Software Operation | 9
074-594-P1H Micro GC Fusion Operating Manual 181 / 319
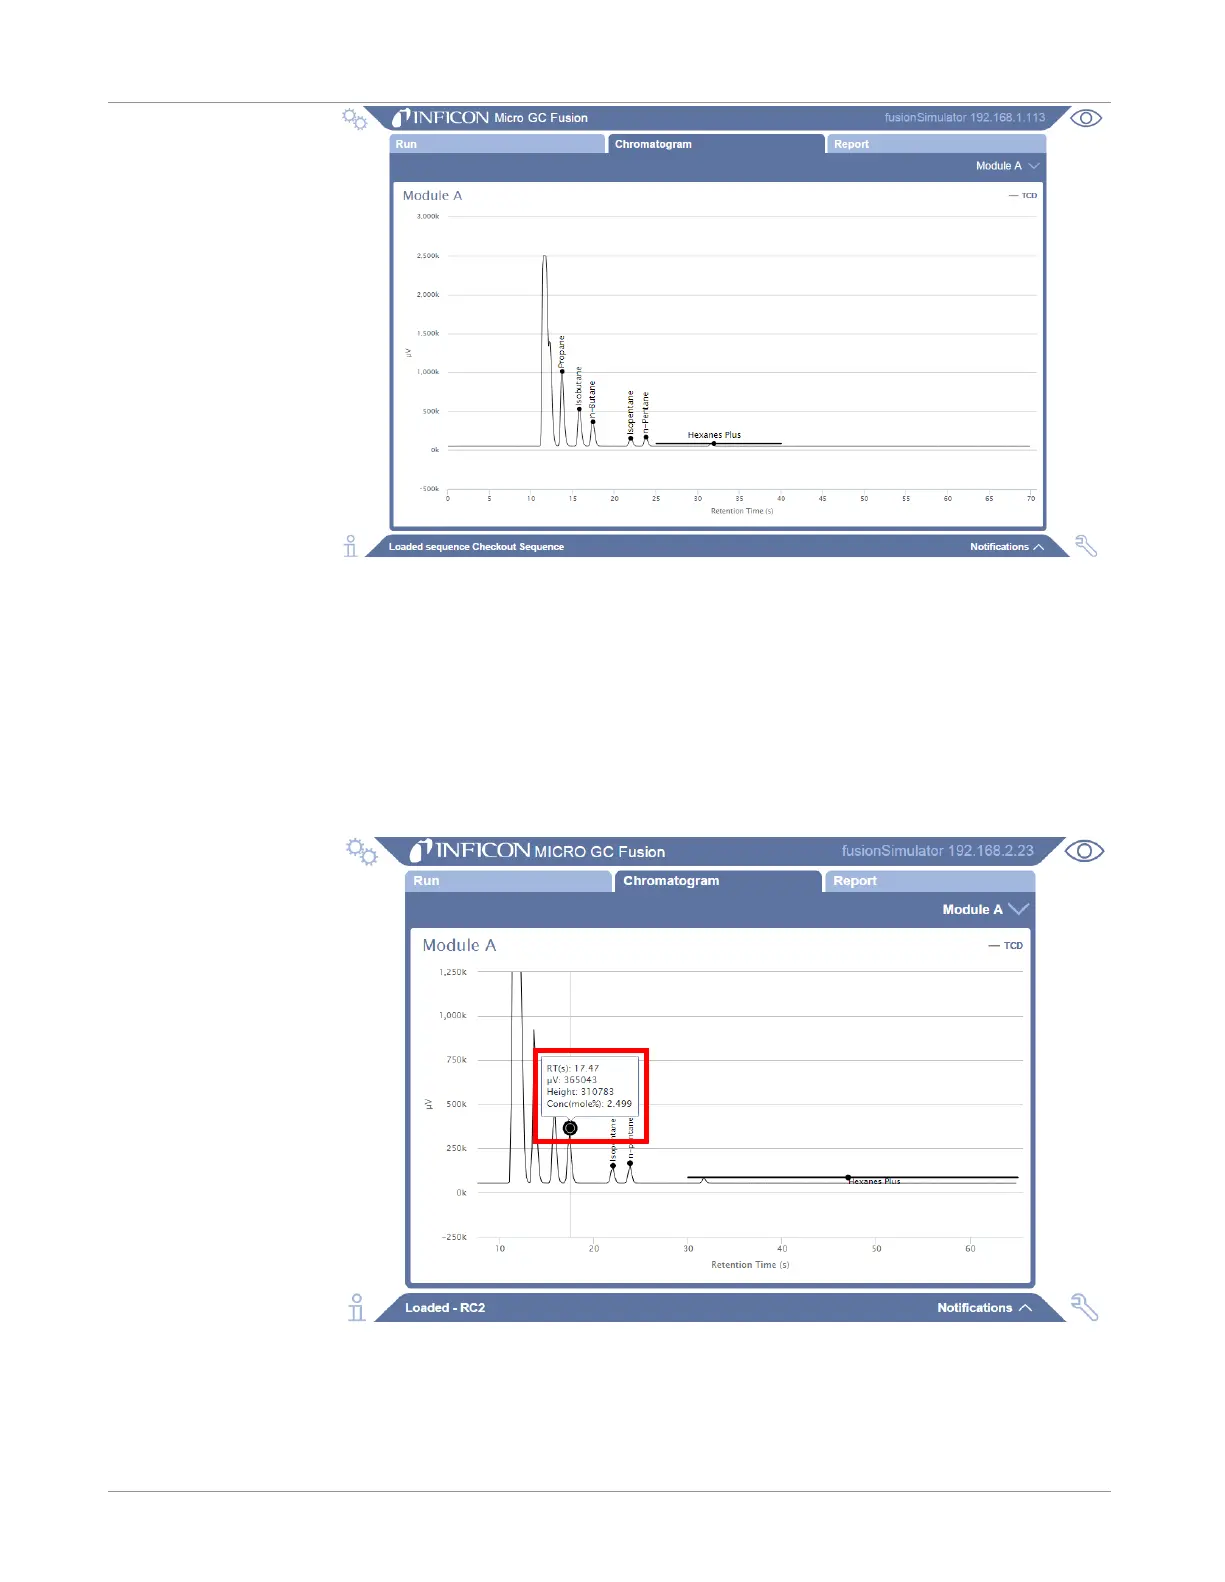
9.7.4 Viewing Coordinates
Hover the mouse over a region of the chromatogram to display a rolling black ball and
a legend displaying
x
and
y
coordinates points on the chromatogram. The
x
axis is the
retention time in seconds. The
y
axis is the peak height in µV.
If hovering over a named peak, the
RT(s)
and the
Height
in µV are displayed.
If the peak has been calibrated,
Conc (mol%)
or
Conc (ppm)
are displayed.
 Loading...