Limit Indications
The display uses colors to indicate limits and limit violations.
Trend Chart (34461A/65A/70A only)
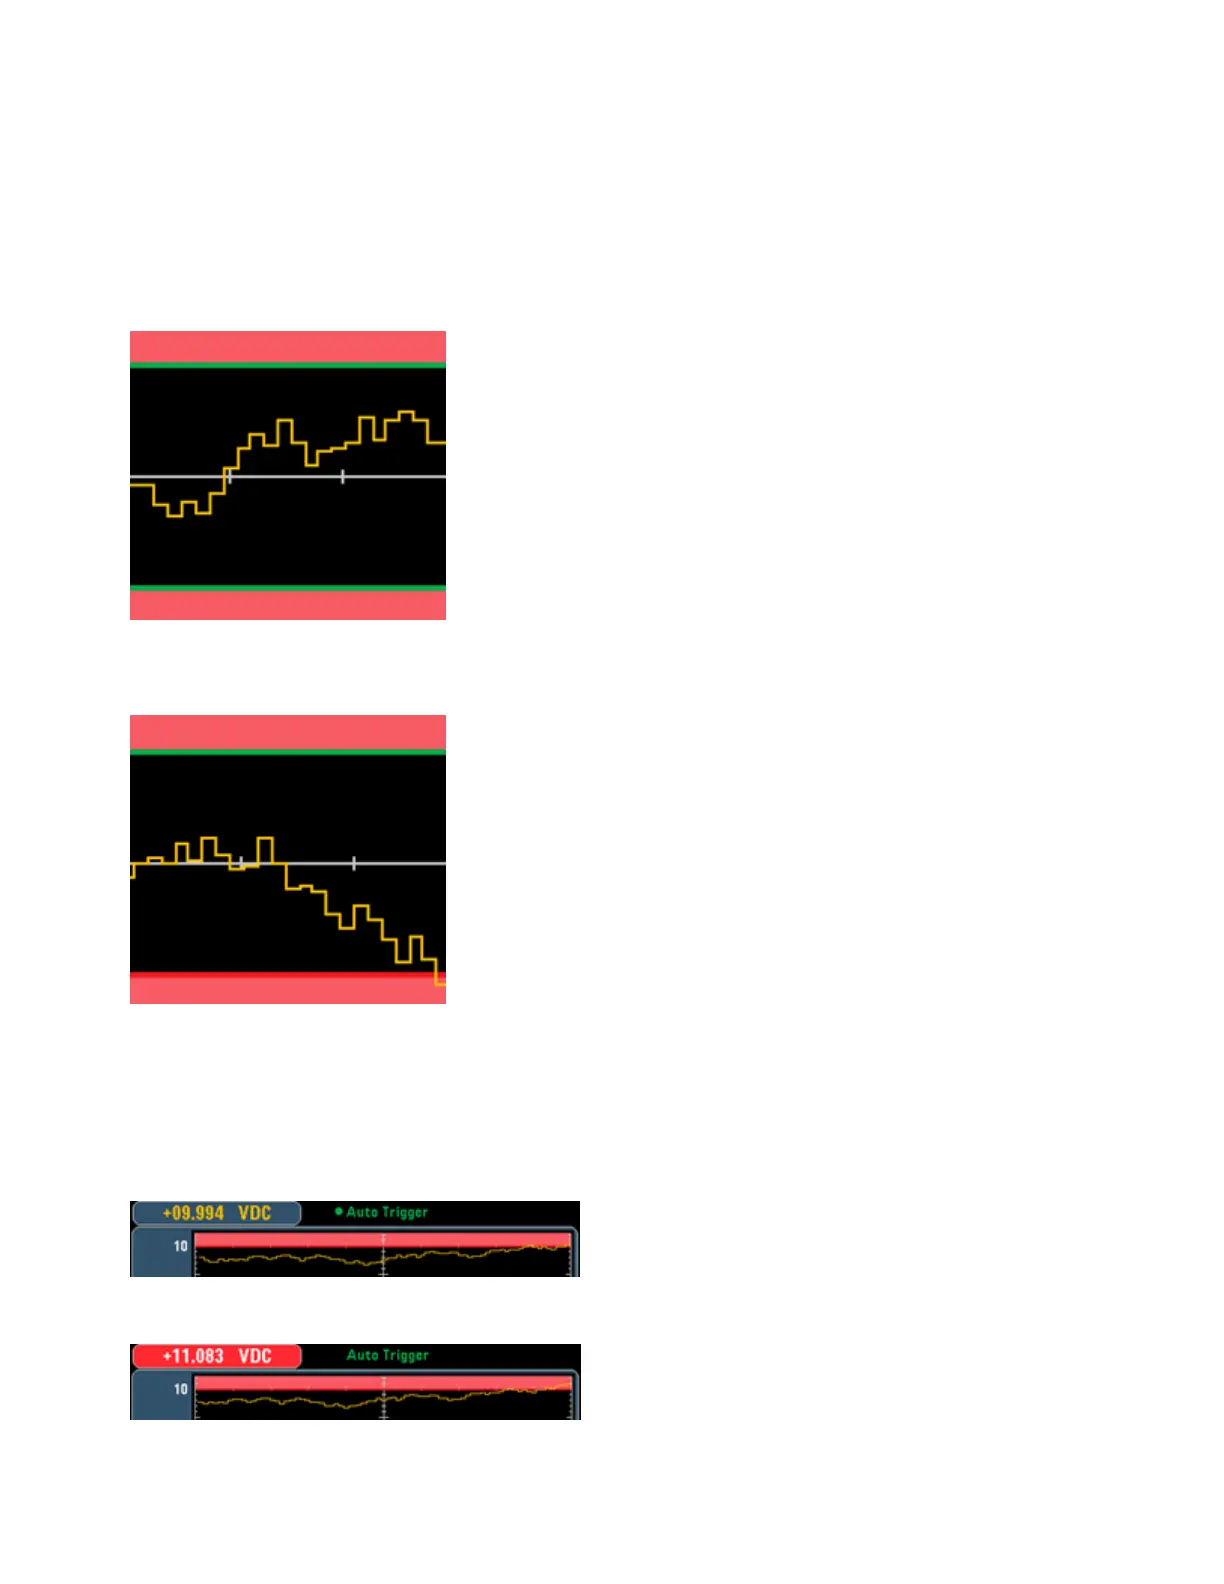
The limit area is shown in light red on the graph. The limit borders are green (shown below) as long as the
limits have not been exceeded.
When a limit is exceeded, the border turns red. In the image below, the top border is still green, but the
bottom border has changed to red because the trend line has gone into the lower limit area.
The border will remain red even if the trend line moves out of the limit area. When the trend line is within
limits, you can reset the borders to green by pressing Clear Condition.
Note also that the number of the newest displayed measurement, +09.994 VDC below, indicates whether
the measurement is within limits. Because the limit is 10 V, the 9.994 VDC value is shown with the stand-
ard background.
In contrast, the 11.083 VDC reading is highlighted in red to indicate that it is outside the limits.
Keysight Truevolt Series Operating and Service Guide
111
Features and Functions