DiagnosticsDiagnostics
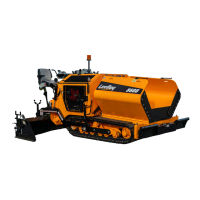
Select Diagnostics from the rst Main Menu screen.
(Figure 4-18 on the previous page.)
Use the UP (
>
) or DOWN (
>
) arrow keys (Buttons 1
and 2) to navigate to either the Active Diagnostics or
Logged Diagnostics screens. (Figure 4-20) When the
cursor (>) points to the screen you wish to view, press
the Select (√) key.
Figure 4-20. Diagnostics Screen
Active Diagnostics: The Active Diagnostics screen
displays active warnings or faults with the appropriate
Suspect Parameter Number (SPN) and Failure Mode
Indicator (FMI). It may also display text description and
ID/Name of the device that transmitted the message.
Logged Diagnostics: The Logged Diagnostics
screen displays nonactive warnings or faults with the
appropriate Suspect Parameter Number (SPN) and
Failure Mode Indicator (FMI) that are stored in the
system.
NOTE: When reviewing Logged Diagnostics, the user
can press Freeze Frame to view a snapshot of certain
engine parameters and the hour meter reading at the
time of the fault. This can help correlate recent machine
activity with the faults that have been recorded.
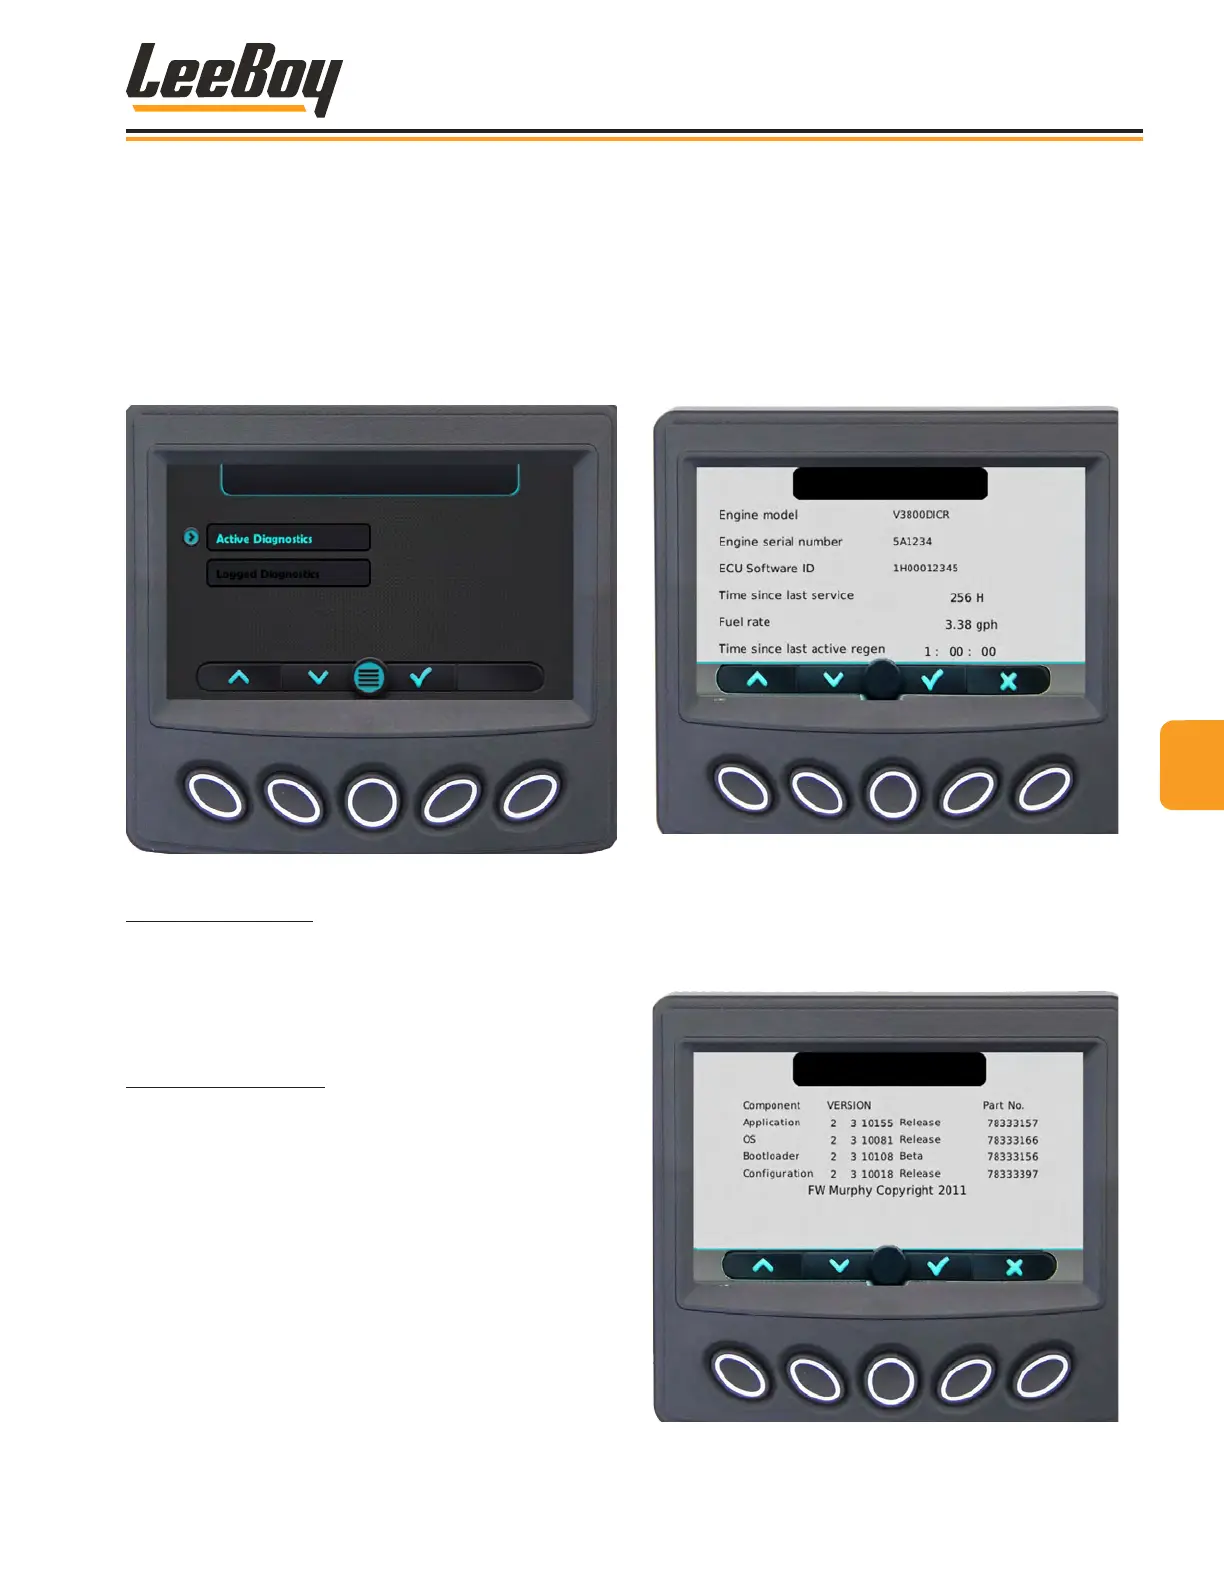
System InfoSystem Info
Select System Info from the rst Main Menu screen.
(Figure 4-18 on the previous page.) Press the DOWN
(V) arrow to scroll through the two System Info screens.
(Figures 4-21 and 4-22) The rst screen displays the
engine model, serial number, ECU Software ID, fuel rate,
and the amount of time since the last active regenera-
tion process was performed.
Figure 4-21. System Info Screen
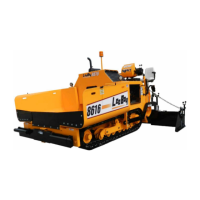
Press the DOWN (V) to scroll to the second screen con-
taining application and conguration information, which
provides the current software version loaded into the
controller. (Figure 4-22)
Figure 4-22. Application and Conguration
Information Screen
44
Operation
8608 Commercial Paver 4-13