MLA System USER GUIDE
MLA System User Guide V2.1 153
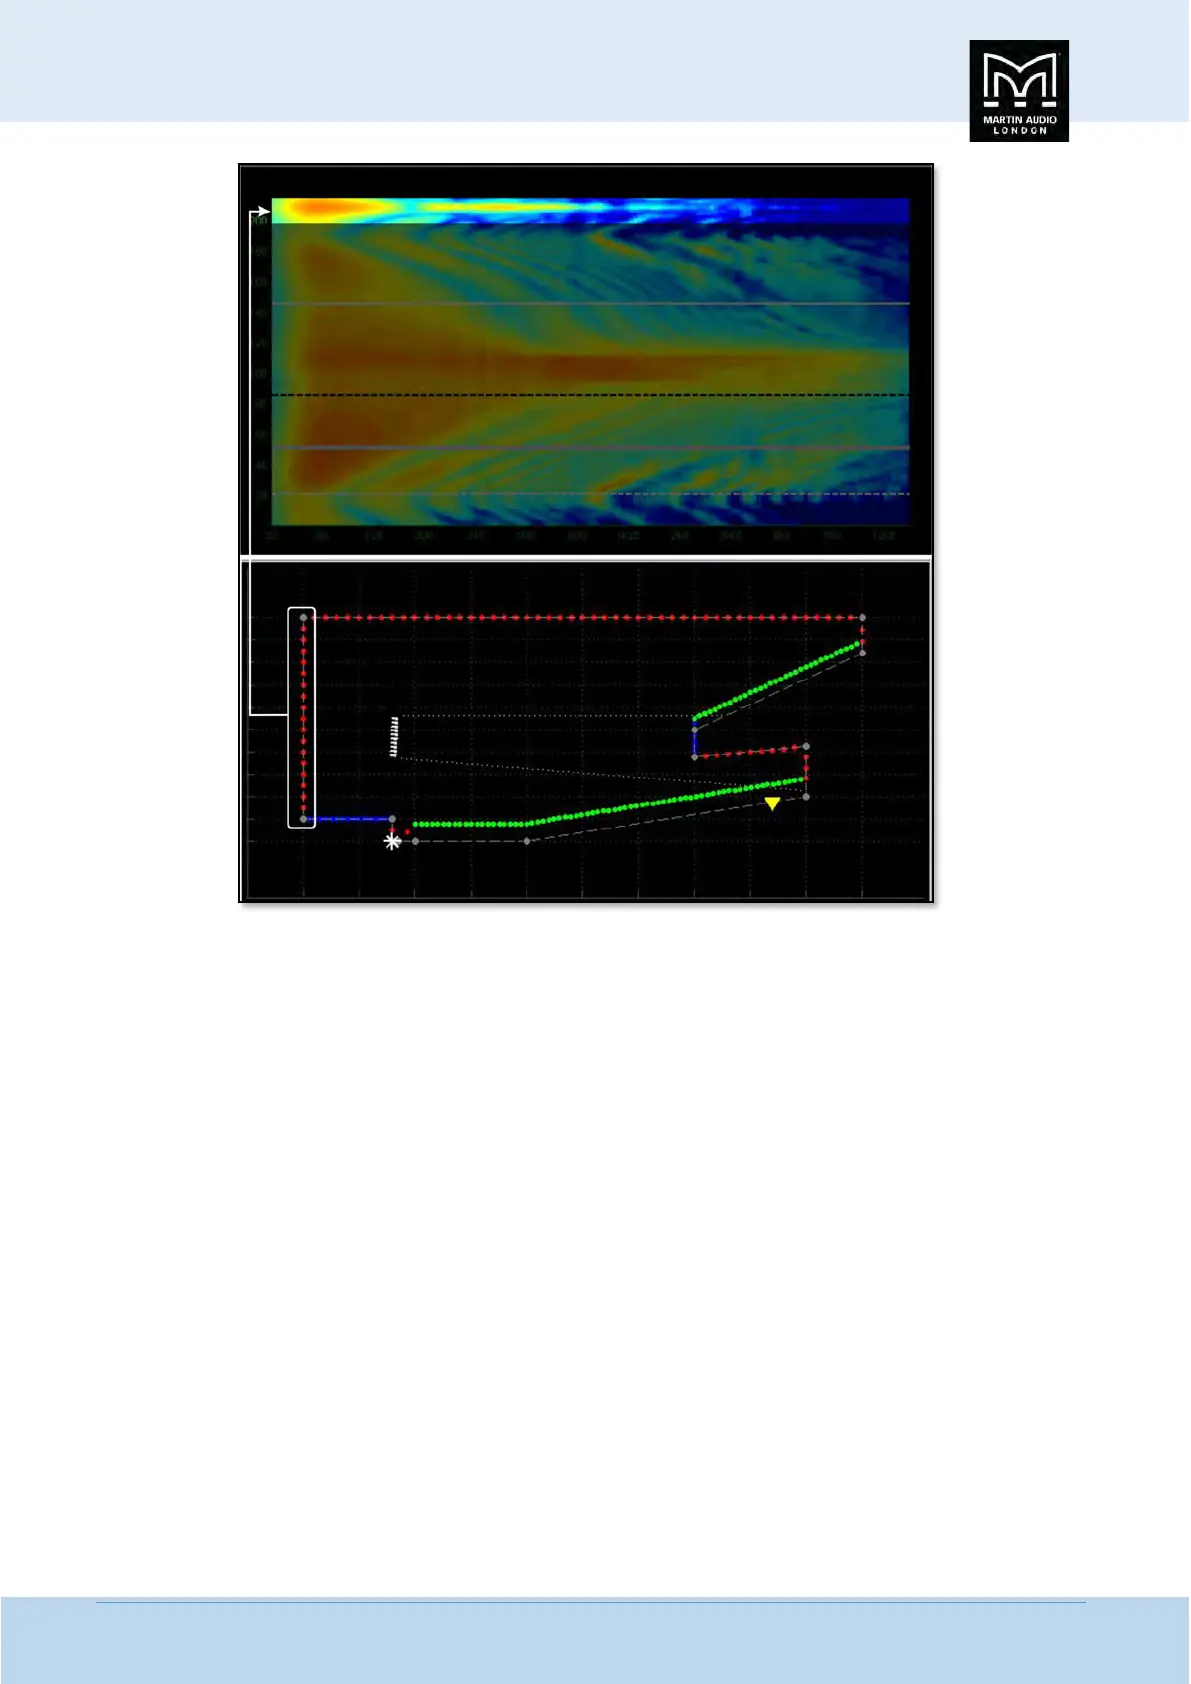
And finally the rear wall.
We can also take a look at the actual frequency response on a conventional graph at any specific point on the plot to better
understand what we are looking at. Just to re-emphasis, these plots are prior to any system optimisation; they show the response
of an array flown with all angles at 0.5⁰!