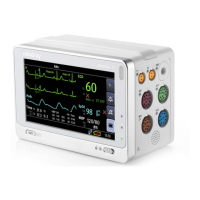
7 - 16 BeneVision N1 Patient Monitor Operator’s Manual
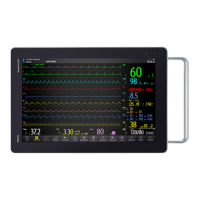
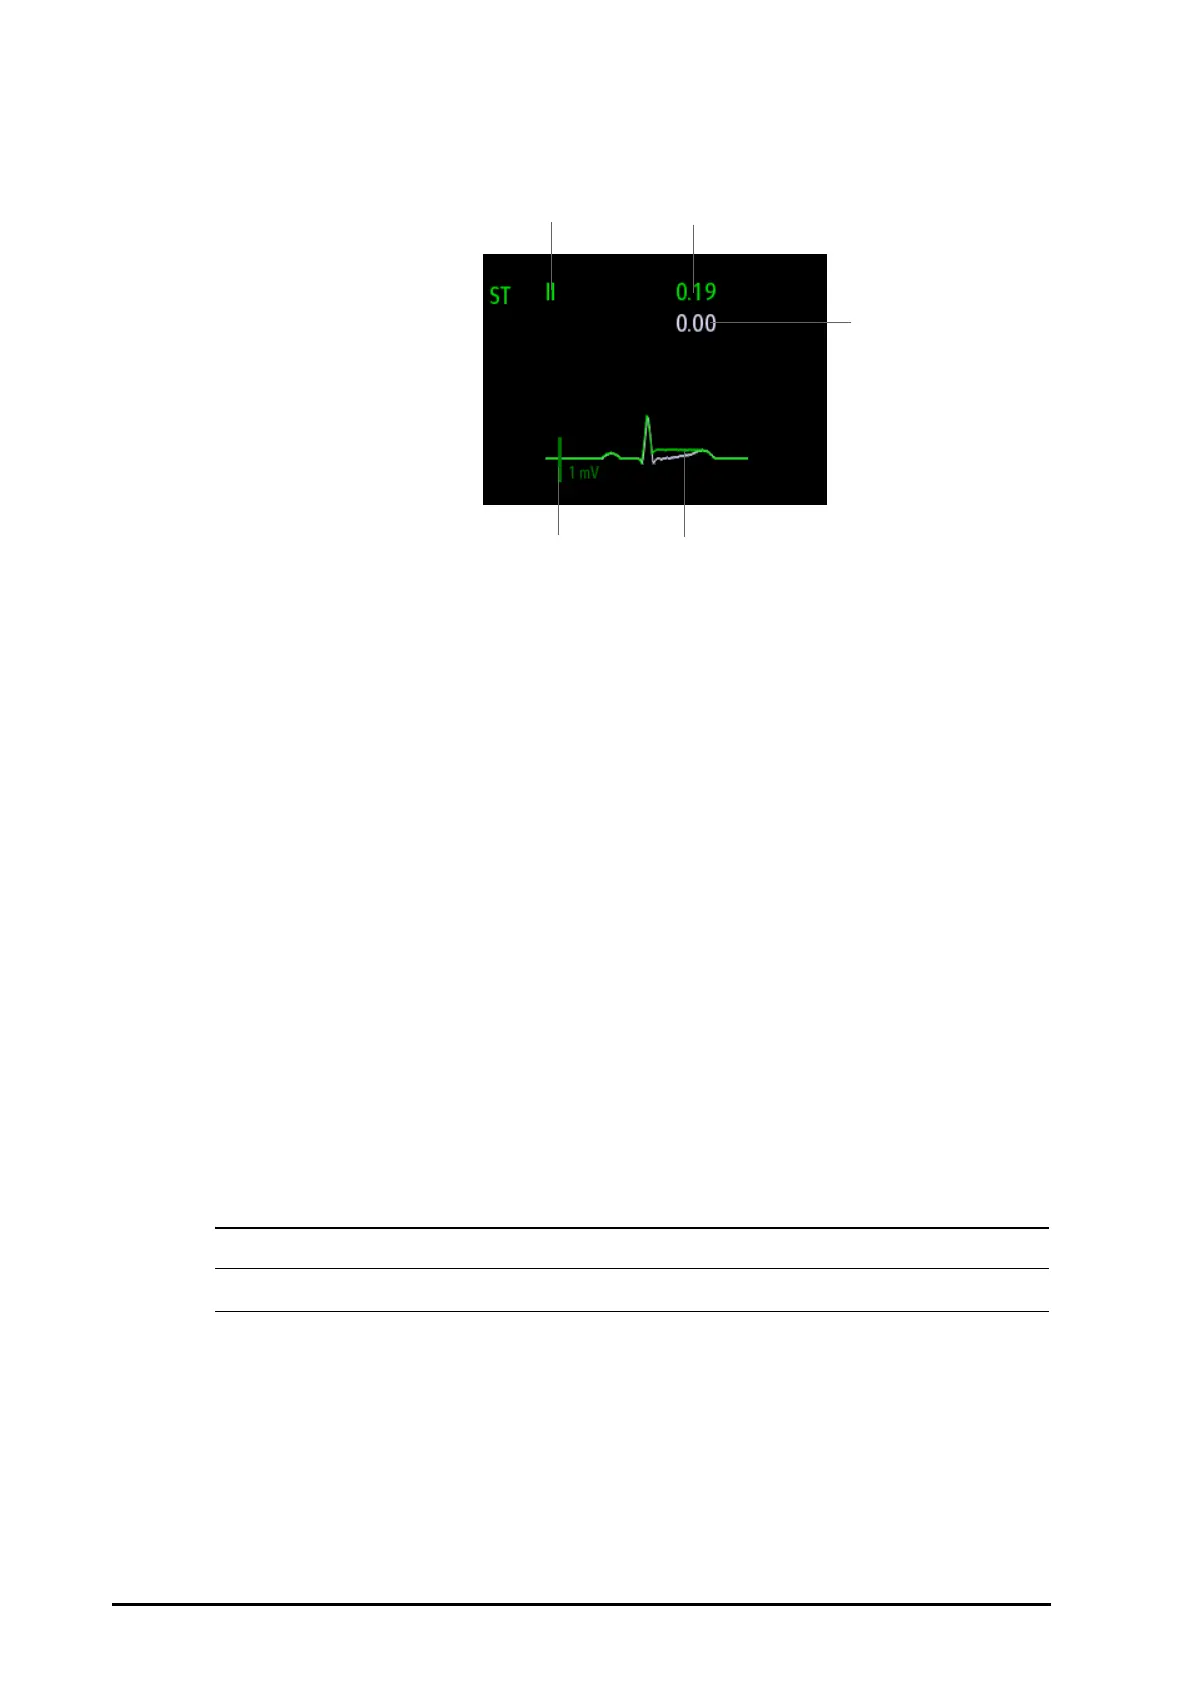
ST segment shows a QRS complex segment for each measured ST lead. The current ST segment is drawn in the
same color as the ECG wave, usually green, superimposed over the stored reference segment, drawn in a
different color. The information is updated once every ten seconds.
7.7.5 Entering the ST View
In ST View mode a complete QRS segment for each ST lead is displayed. The color of the current ST segments
and ST deviation values is consistent with the color of the ECG waveforms, normally green. The color of the
baseline ST segments and ST deviation values is white.
To enter the ST View, follow this procedure:
1. Select the ECG numeric area or waveform area to enter the ECG dialog.
2. Select the ST tab.
3. From the bottom of the dialog, select ST View.
7.7.6 Saving the Current ST Deviation and Segment as Baseline
ST deviation is typically monitored as a relative change from a baseline value. Set an ST baseline when ST
deviation values become stable. If you did not set the ST baseline, the monitor automatically saves the baseline
when valid ST deviation values appear for 5 minutes. To set the ST baseline, from the ST View, select Set
Baseline.From the ST View, you can also perform the following operations:
■ Display or hide ST baseline by selecting Display Baseline or Hide Baseline.
■ Display or hide the position of ISO point, J point and ST point by selecting Display Marker or Hide Marker.
• Updating ST baseline affects ST alarms.
7.7.7 Entering the ST Graphic (only available when the N1 is used with the
independent external display)
To display ST Graphic, follow this procedure:
1. Select the ECG numeric area or waveform area to enter the ECG dialog.
2. Select the ST tab.
3. Select ST Graphic.
(1) ST lead (2) Current ST deviation value
(3) Baseline ST deviation value (4) 1 mV scale
(5) Current ST segment (green) and baseline ST segment (white)