Programming Measurements
R&S
®
NRP2
395User Manual 1173.9157.02 ─ 03
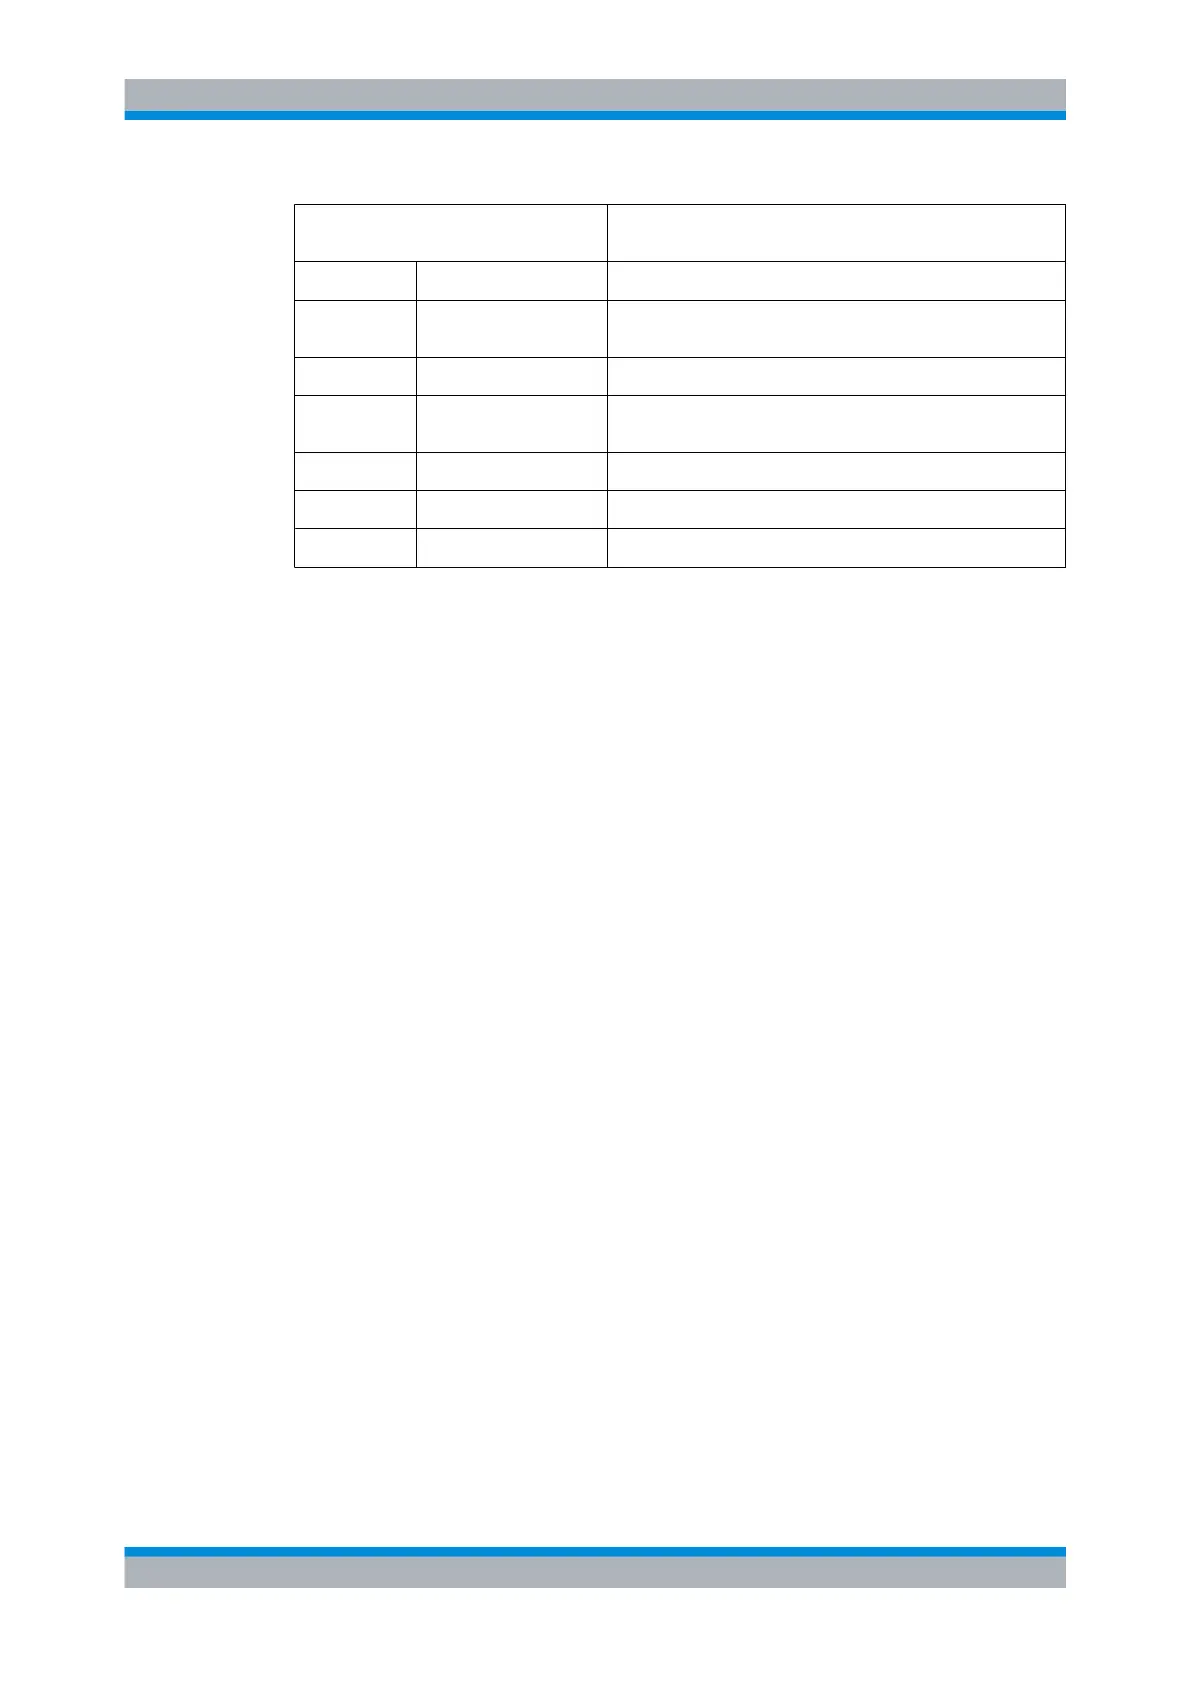
Keyword for selecting a calculation
function with high-level commands
Corresponding low-level commands (n,m=1,2,3,4)
:DIFF
(Difference) CALC:MATH "(SENSn-SENSm)";REL:STAT OFF
:DIFF:REL
(Difference with refer-
ence value)
CALC:MATH "(SENSn-SENSm)";REL:STAT ON
:RAT
(Ratio) CALC:MATH "(SENSn/SENSm)"; REL:STAT OFF
:RAT:REL
(Ratio with reference
value)
CALC:MATH "(SENSn/SENSm)"; REL:STAT ON
:SWR
(Standing wave ratio) CALC:MATH "SWR(SENSn)"; REL:STAT OFF
:RLOS
(Return loss) CALC:MATH "RLOS(SENSn)"; REL:STAT OFF
:REFL
(Reflection coefficient) CALC:MATH "REFL(SENSn)"; REL:STAT OFF
Example
*RST
CALC:MATH "(SENS1/SENS2)" 'processes sensors 1 and 2
CALC:REL:STAT ON 'relative measurement
CALC:REL 23 dB 'sets reference value
INIT:ALL 'starts measurements on all sensors
FETCh?
C.5 Statistics measurements
There are no high-level commands available for statistics measurements. The measure-
ments must therefore be performed with the aid of the low-level commands.
Two basic types of measurements are conceivable:
●
Measurement of a density/distribution curve versus power. An array of statistic values
is returned.
●
Measurement with the aid of markers. Scalar values at the marker positions are cal-
culated. Either the power or the density/distribution value can be specified.
C.5.1 Measurement of a density/distribution curve
The sensor measures the power in a time interval that is determined by
theSENS:STAT:OFFS and SENS:STAT:TIME commands. Triggering functions in a per-
fectly normal way, as with other measurements. In principle, the number of (power) sam-
ples considered could be set by means of filtering. The higher the filter value, the more
samples are included in the statistics and the greater the measurement accuracy. How-
ever, the filter commands should not be used here, since the minimum number of samples
can be set much more conveniently using the SENS:STAT:SAMP command.
By means of the measured powers, the statistics function determined with SENS:FUNC
is now calculated. The power range is limited using the SENS:STAT:SCAL:X:RLEV and
Statistics measurements