Instrument Functions
R&S
®
NRP2
112User Manual 1173.9157.02 ─ 03
4.5 Displaying traces
Many sensors allow you to graphically display the envelope power versus time, and some
also allow you to display the amplitude distribution as CCDF, CDF or PDF.
Two waveforms or two amplitude distribution functions can be shown in the same dia-
gram. A waveform may either be a representation of absolute envelope power for one
channel over time or the ratio of the envelope powers of two channels over time.
4.5.1 Basic settings for trace display
The trace display can be quickly selected after a preset.
1.
Connect a sensor to the R&S NRP2 (any channel). The sensor must support trace
measurements (true for all sensors except for the R&S NRP-Z9x, R&S NRP-Z5x, and
R&S NRP-Z27/-Z37 sensors)
2. Apply a pulsed signal to the sensor. The amplitude of the signal has to be sufficient
for reliable triggering.
3. Perform a preset (PRESET hardkey)
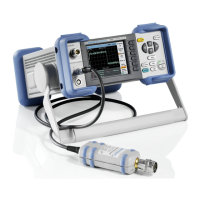
4. Select "Mode" in the "Sensor" menu.
The "Mode" dialog box opens.
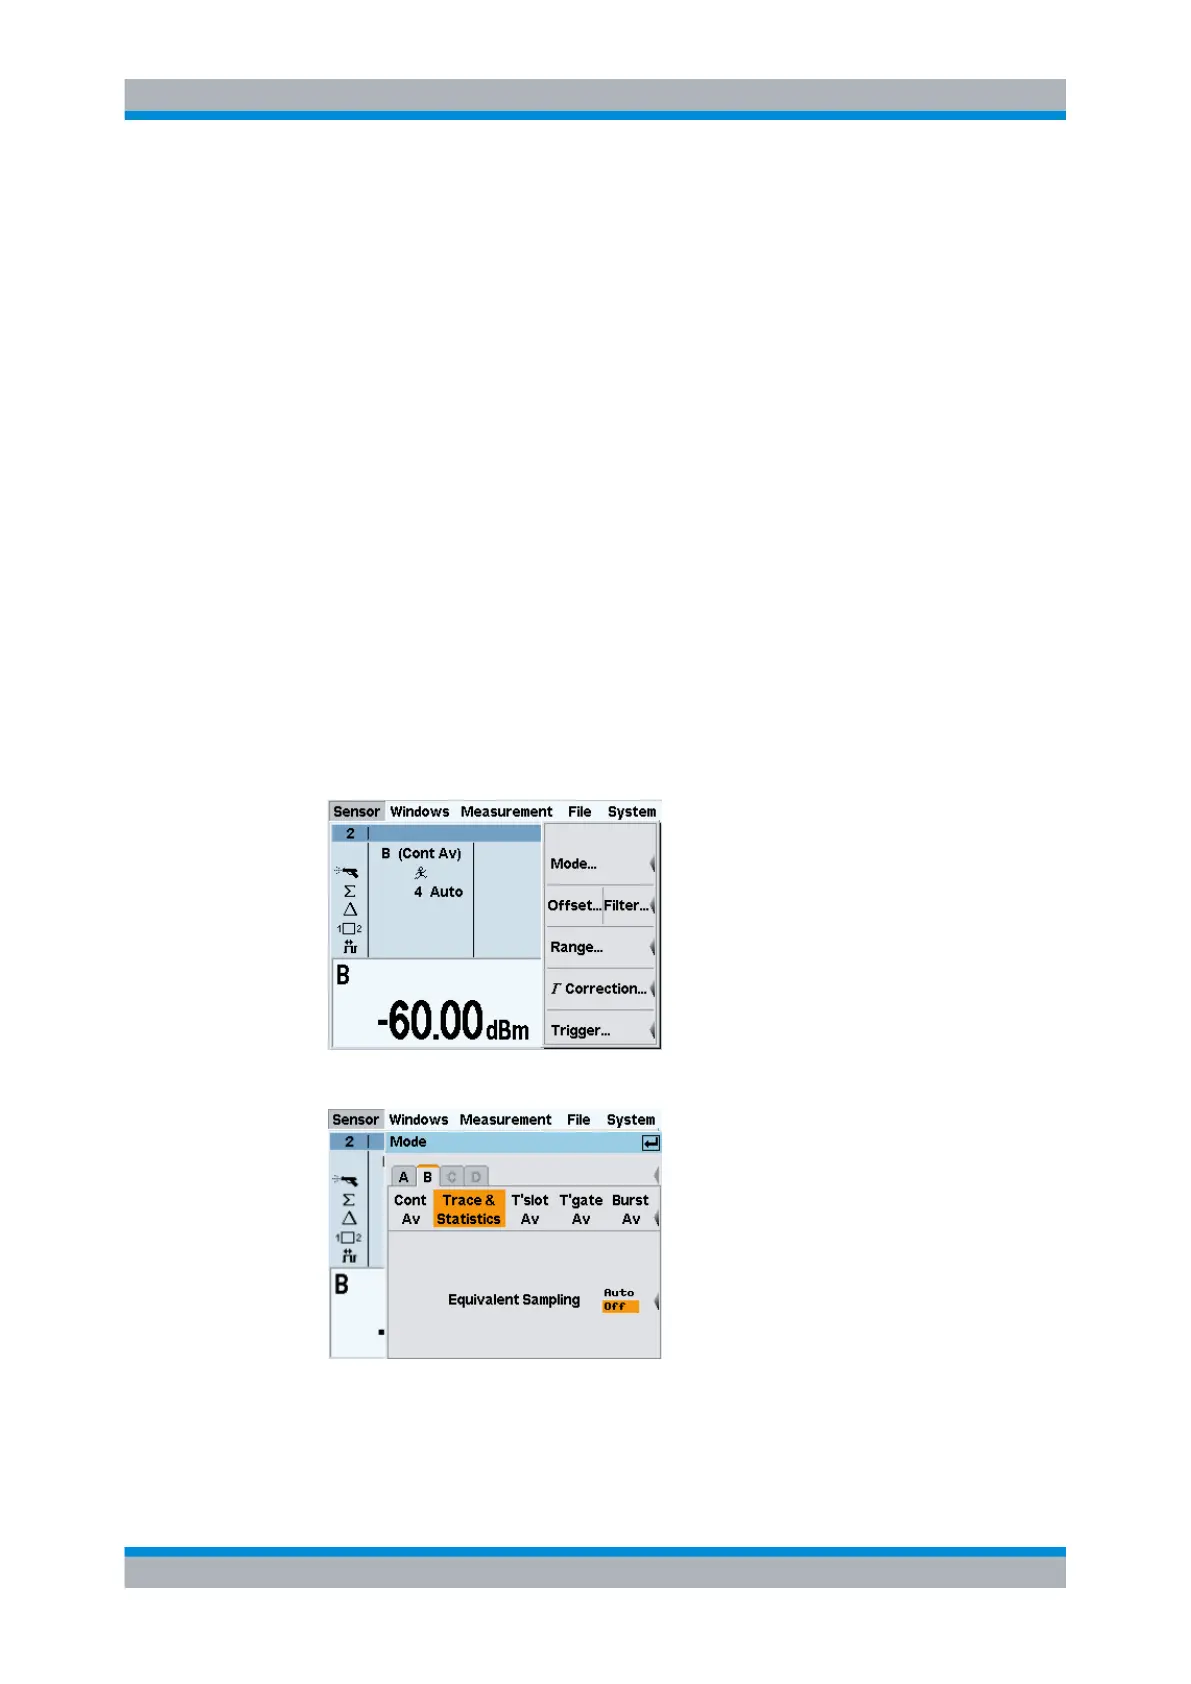
5. Select "Trace & Statistics".
The trace window opens.
Displaying traces
 Loading...