Getting Started
R&S
®
NRP2
42User Manual 1173.9157.02 ─ 03
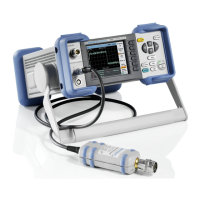
Fig. 2-29: Function & Unit dialog box / unit
The ratio of two powers is dimensionless – this is why only "dB", "Δ%" and "1" are
available in the unit list. The symbol "Δ%" represents the difference between the
power values in W, given in % (0 % means the powers in both channels are equal).
The symbol "1" represents the quotient of the power values in W, i.e. not the log of a
ratio.
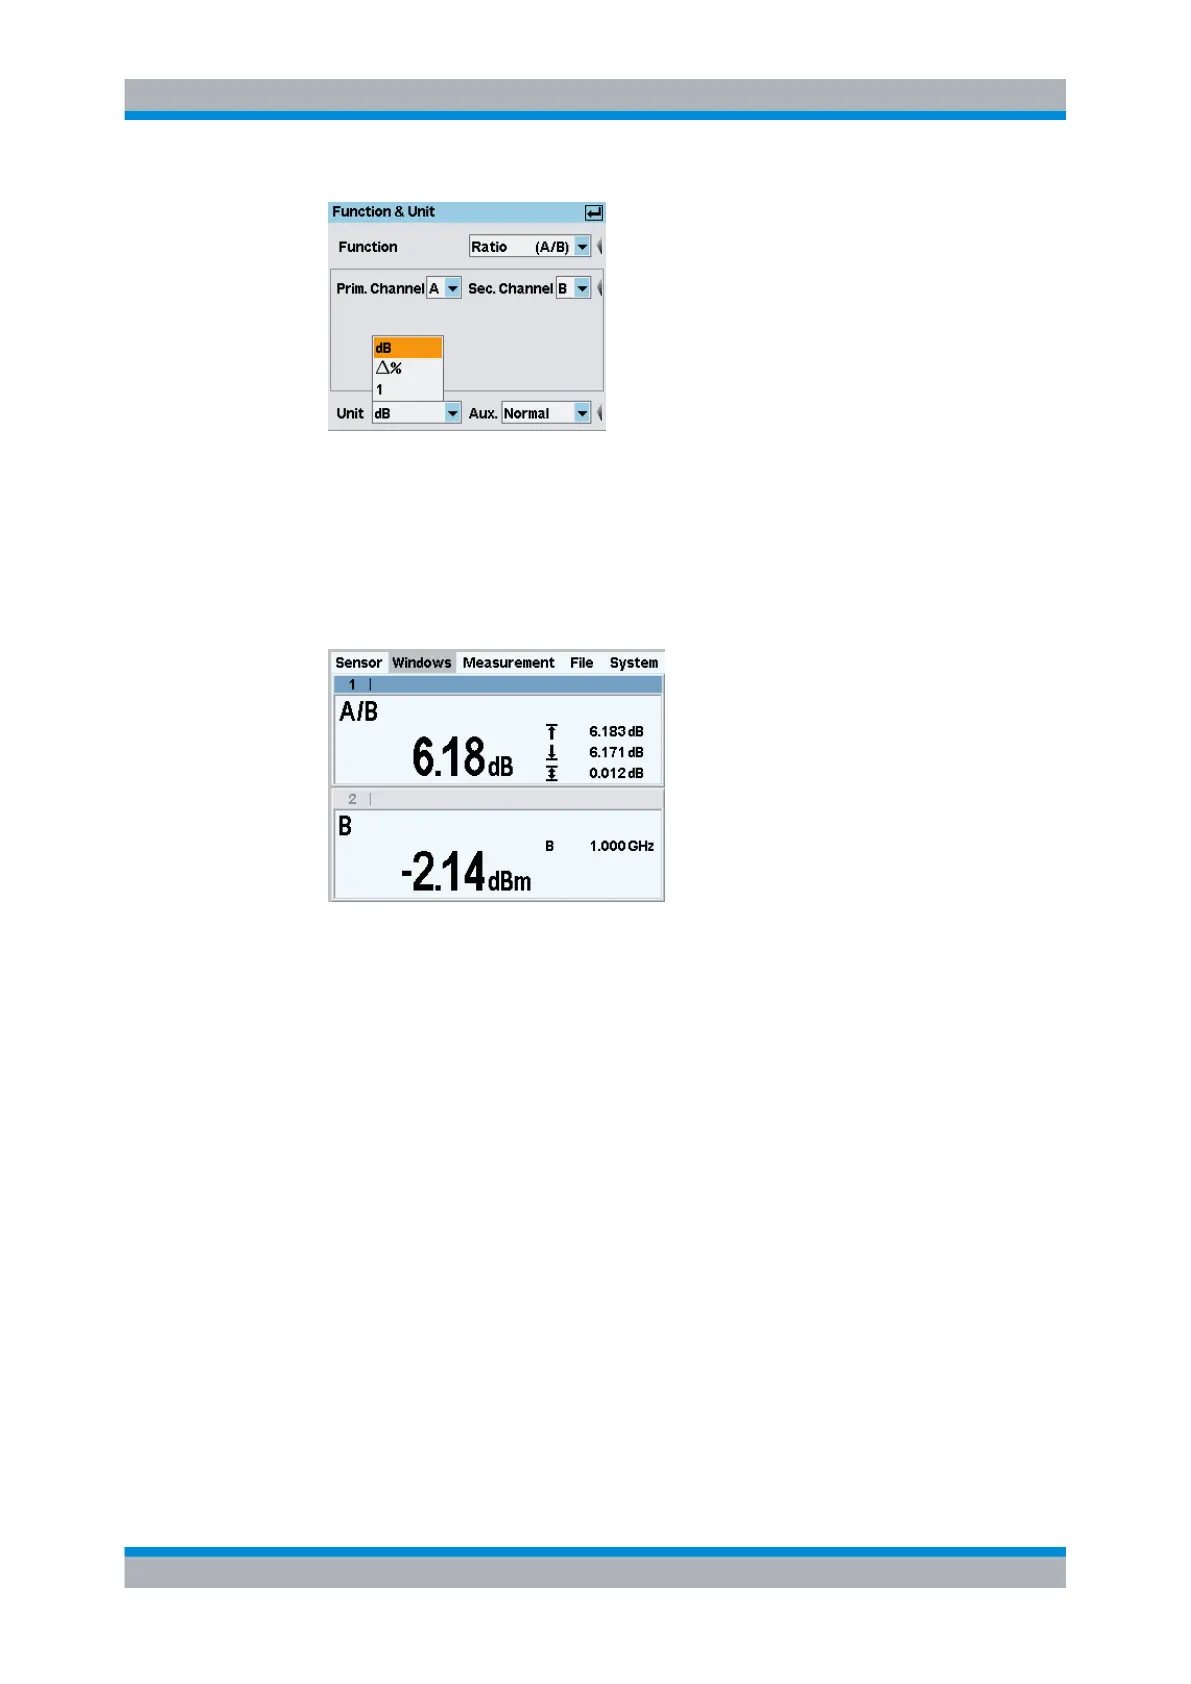
Fig. 2-30: Result windows / sensor A and B
2.7
Graphically representing power versus time
In the "Trace & Statistics" mode, power versus time can be represented graphically as
with an oscilloscope. If you wish to carry out measurements on signals with modulated
power envelope (in the Burst or Timeslot mode), initially displaying the signal in the Trace
mode is always recommended. Stable triggering by the R&S NRP2 can more easily be
accomplished in this mode.
Setting the "Trace & Statistics" mode.
1.
Connect a power sensor of the R&S NRP-Z1x, R&S NRP-Z2x or R&S NRP-Z8x family
to connector A of the R&S NRP2.
2. Apply an amplitude-modulated or pulsed signal having a modulation frequency or
pulse frequency of approx. 1 kHz. The maximum level should be between –10 dBm
and +10 dBm.
A pulse with 250μs width, a period of 1ms, and 4dBm is used in the following example.
Graphically representing power versus time