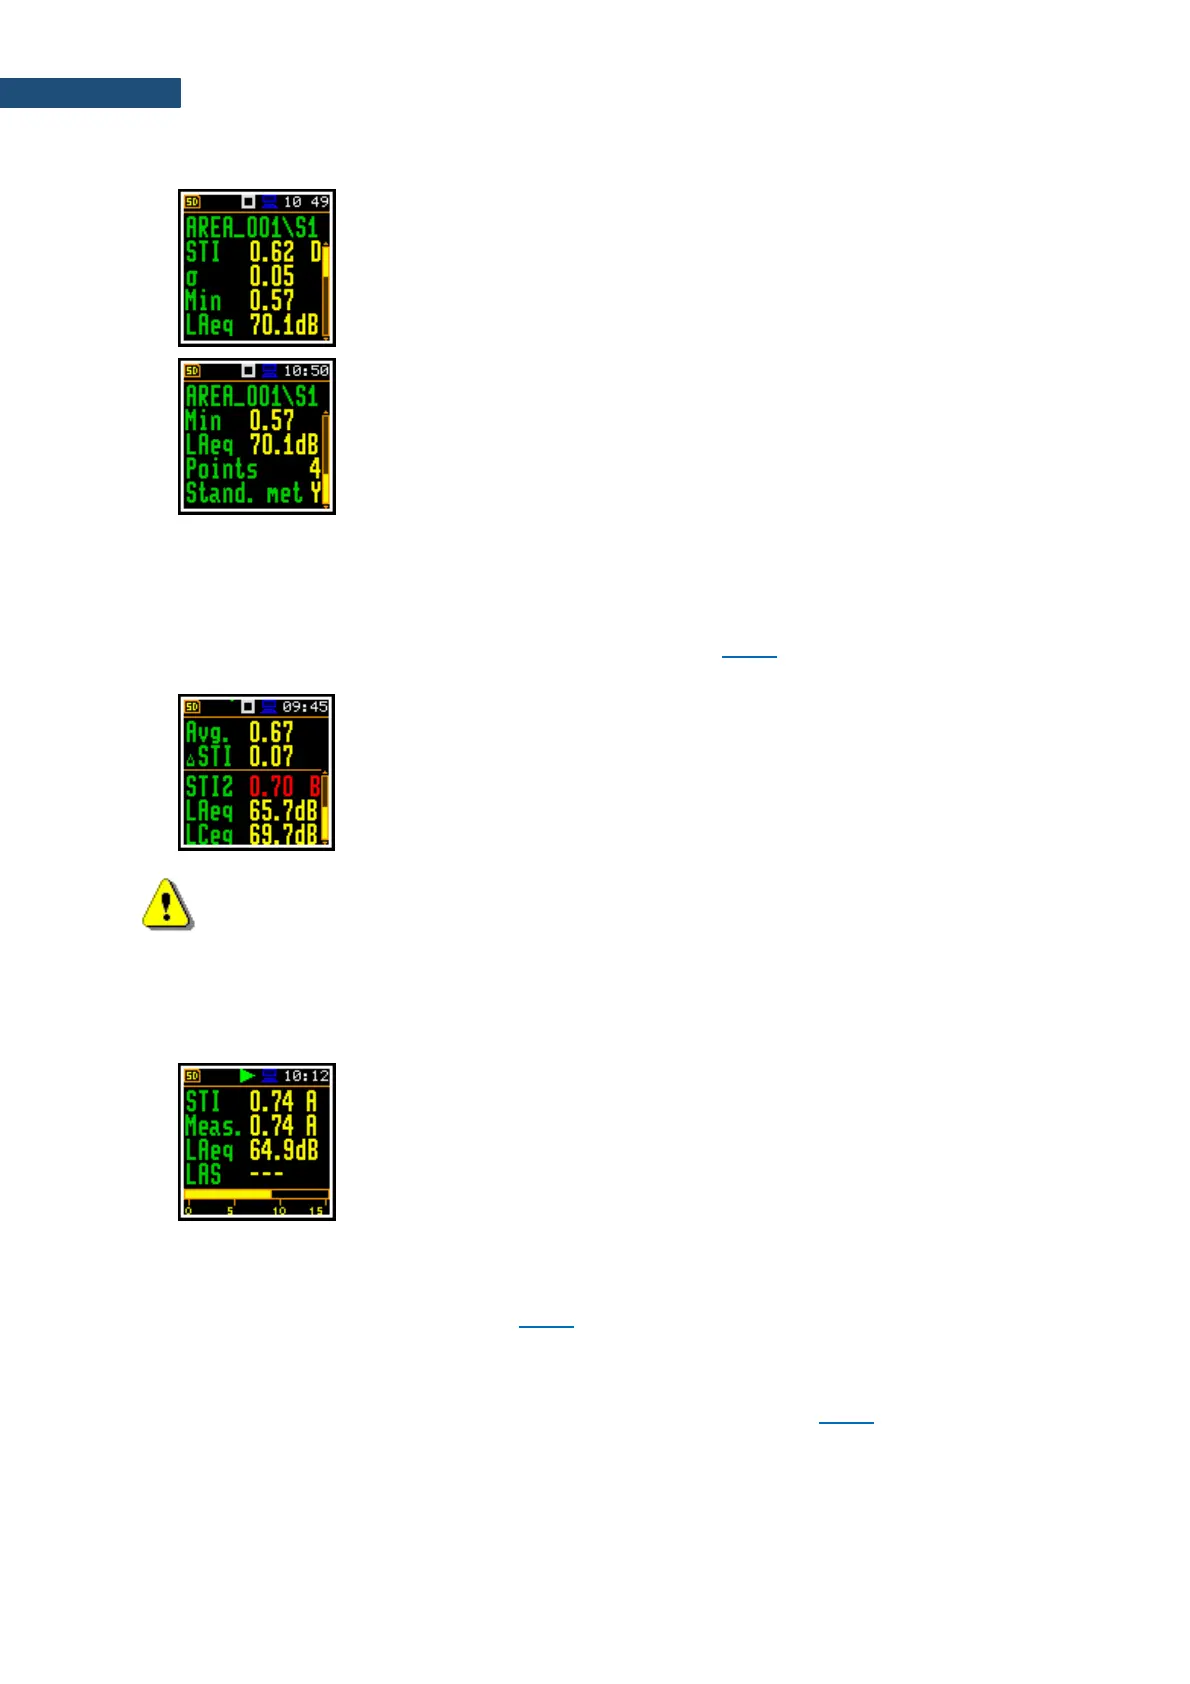
• Area summary view is a main STIPA view that presents summary results for the current area:
o Averaged STI or CIS index with consideration of the Ambient
noise distortions.
o σ - standard deviation of measured STI indexes for the area.
o Min – minimal STI value.
o LAeq – averaged LAeq for the area.
o Number of measurement points (Points) taken into
consideration for the summary results calculations.
o Conformity of measurements with the selected standard
(Stand. met): Yes (Y) or No (N).
• Point view is a main STIPA view. The Point view allows you to see the modulation function, to delete
measurements (only for the last measurement point) and exclude measurement results from the
calculation of the averaged STI index. It always appears after Measurement view for the last
measurement point or when you select the measurement point in the Area view and choose the
Point view command in the command list (see Chapter 13.3.6). This view presents a list of
measurements for the measurement point with following results:
o Averaged STI or CIS index with consideration of the Ambient
noise distortions (Avg.) and the index spread (ΔSTI/ΔCIS) for the
measurement point.
o STIx results with considered ambient noise, STI qualification
band, LAeq and LCeq results for the individual measurement (x:
1, 2, ..). Red colour of the STIx result indicates errors or
disruptions detected during the measurement.
Note: You can switch between main views with the ▼/▲ key pressed together with <Shift>.
• Measurement view appears when you start a new measurement (manually or automatically). This
view presents measured results which are updated every second and a progress bar of the
measurement that lasts 15 seconds:
o STI index with consideration of the Ambient noise or without
(Meas.) and the STI qualification band.
o LAeq and LAS for the current measurement time.
After completion of the measurement, the instrument will automatically switch to the Point view and
the measurement results will be placed in the measurement list. If you stop the measurement
manually, the instrument switches to the Point view, but the measurement result will not be included
in the measurement list (see Chapter 13.3.6).
• Modulation function view is available when you select the measurement in the Point view and
choose the Modulation command in the command list - see Chapter 13.3.6. This view presents
LZeq and modulation transfer ratios (m(f1), m(f2)) for seven octave bands with central frequency
from 125 Hz up to 8 kHz: