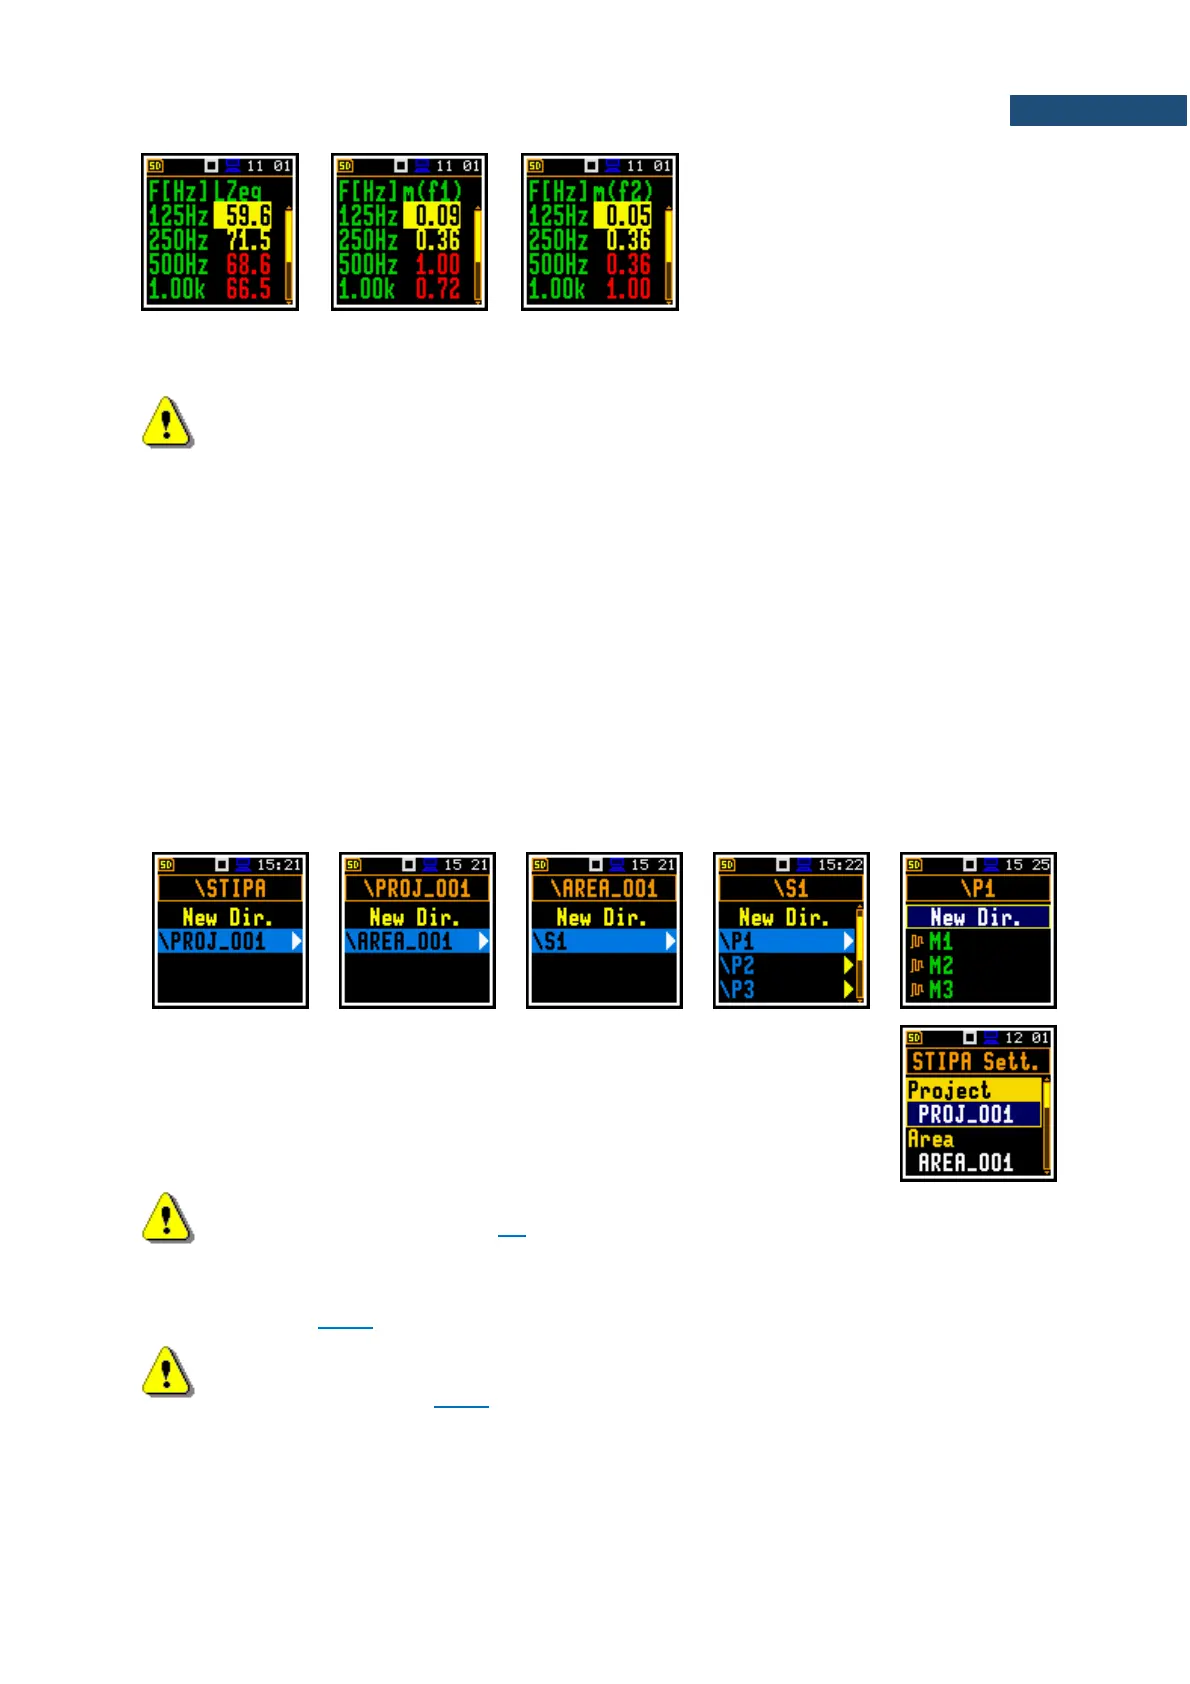
To change columns, use the ◄ / ►
key.
In case the modulation ratios are
greater than 1 due to errors or
disruptions detected during the
measurement, they are given a value
of 1, and the results for this band are
highlighted in red.
To return to the Point view press <Enter> or <ESC>.
Note: Averaged CIS is displayed instead of STI in the Area summary view and in the Point
view when this parameter is selected as Index in the STIPA Settings screen.
Speech intelligibility measurements are organized in the structure of projects. The name of the project is
equal to the name of the directory in the instrument’s memory. Its subdirectories have names of tested
areas. Next down level directories have names of test signal (source) position. The source position
directories include measurement point directory with predefined names (P1, P2 etc.) and the
measurement files are saved in these directories. File contains measured results for the single
measurement.
For example, in the below screens the project directory (PROJ_001) contains one area directory
(AREA_001), which contains one source position directory (S1), which contains two points directories
(P1 and P2).
Directory P1 contains files with measurement results (M1.SVL, M2.SVL …) and one file with the Ambient
noise table (NOISE.SVL).
First three directories are created by the user during configuration of the
STIPA Settings in the Project, Area and Source positions.
Note: Project, Area and Source directories can be created, renamed or deleted via the
File Manager - see Chapter 6.1.
Point directories are created automatically after creating the Next measurement point for the Area during
the measurement process. Measurement files are created automatically every time the measurement
starts (see Chapter 13.3.6).
Note: You cannot delete or rename point directories and measurement file via the
File Manager. You can delete point directory and measurement file using the mechanism
described in Chapter 13.3.6.