5.1.2 Three profiles view
In the 3 Profiles view, any three measurement results,
selected in the Disp. Res list, may be presented for
three profiles. You may change the 3 Profiles sub-view
by pressing the <Enter> key.
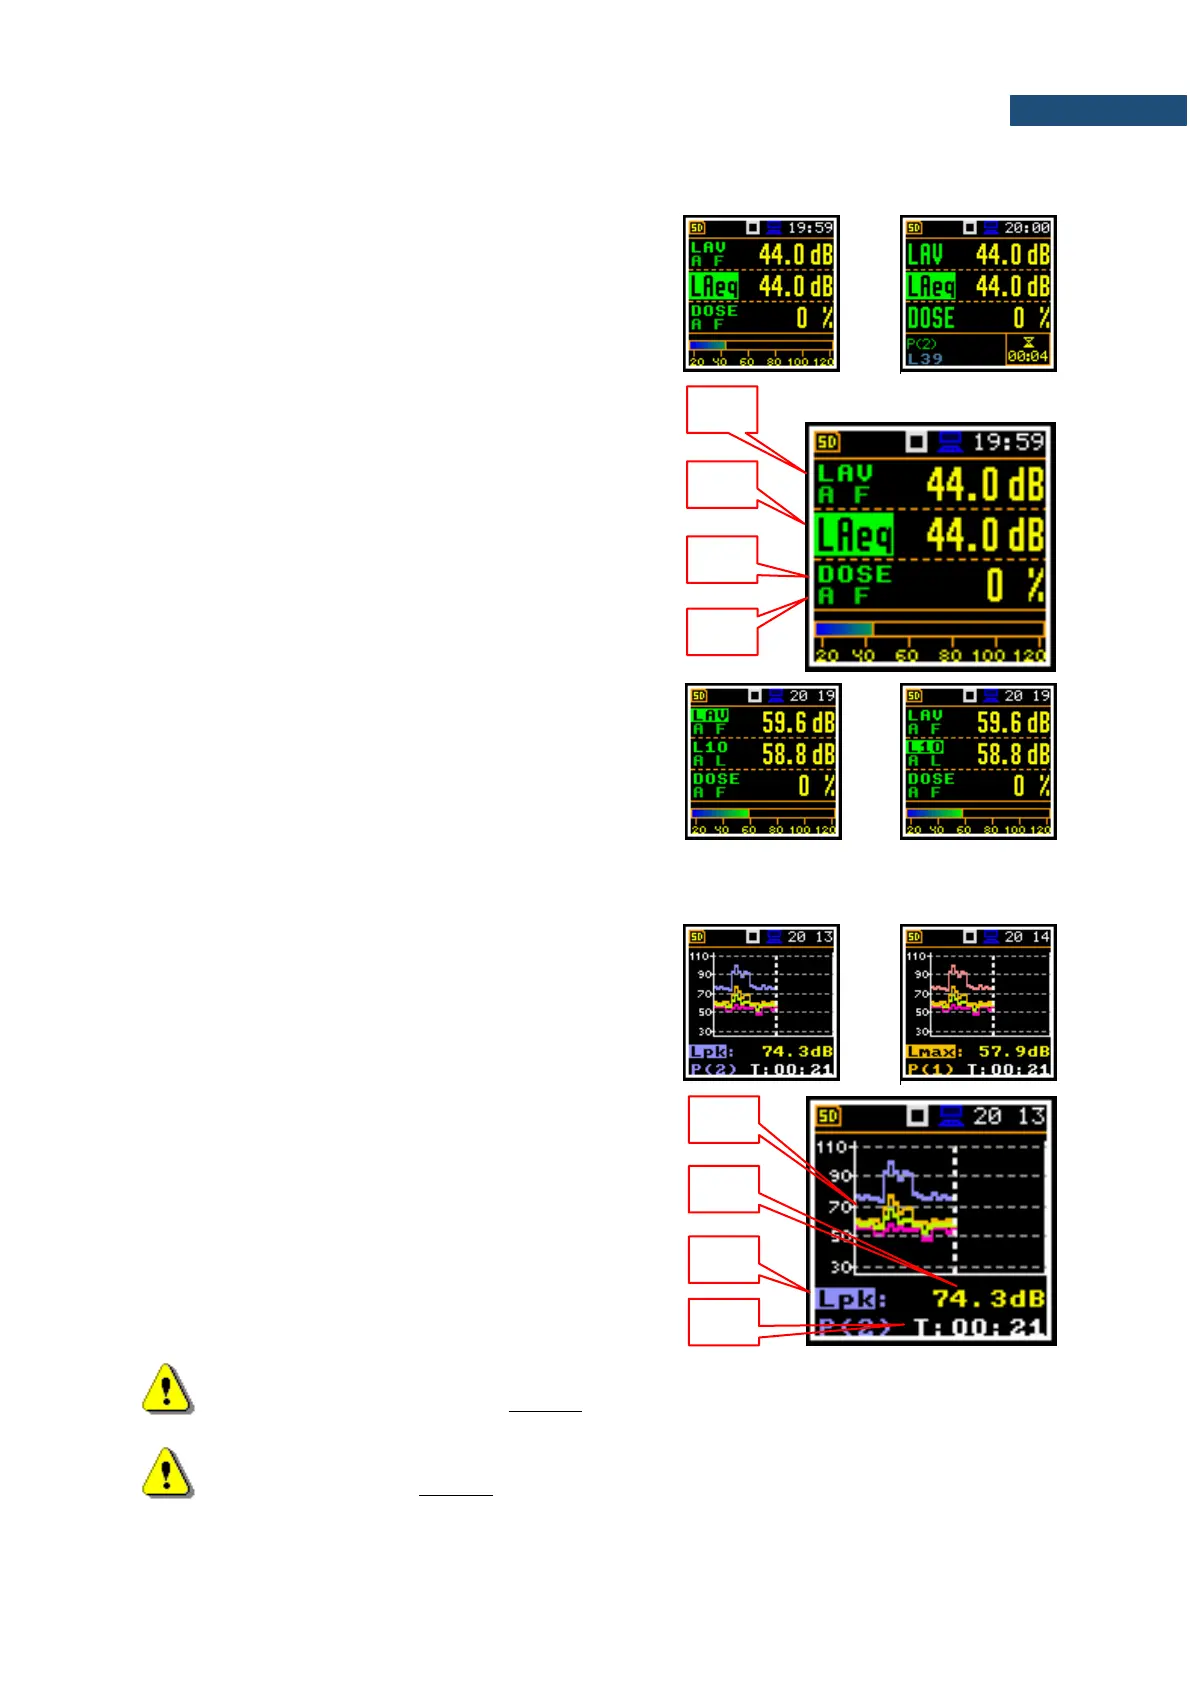
3 Profiles view fields
1. Result for the first profile
2. Result for the second profile
3. Result for the third profile
4. Implemented weighting filter: A, C, Z or B and
detector time constant: I (Impulse), F (Fast), S
(Slow) when the detector is exponential or L when
the detector is linear
Changing measurement results
To change the result of the profile, you should select the
profile with the ▲ / ▼ key pressed with <Shift> and then
change the result with the ◄ / ► key.
The statistical levels can be changed with the ◄ / ► key
pressed with <Shift>.
In the Logger mode, the history results, selected in the
Logger View list, are displayed as a plot. You may
change the active history plot with the <Enter> key.
The cursor position can be changed with the ◄ / ► key.
Logger view fields
1. Logger Plot
2. Result value for cursor position
3. Result name (Profile number)
4. Cursor time position
Note: If Logger (path: <Menu> / Measurement / Logging /Logger Set.) is switched off the
Logger presentation mode is disabled! Therefore, to have this presentation mode active,
switch the Logger on!
Note: When Logger is switched on, but results were not selected for logging the Logger
presentation mode is disabled!