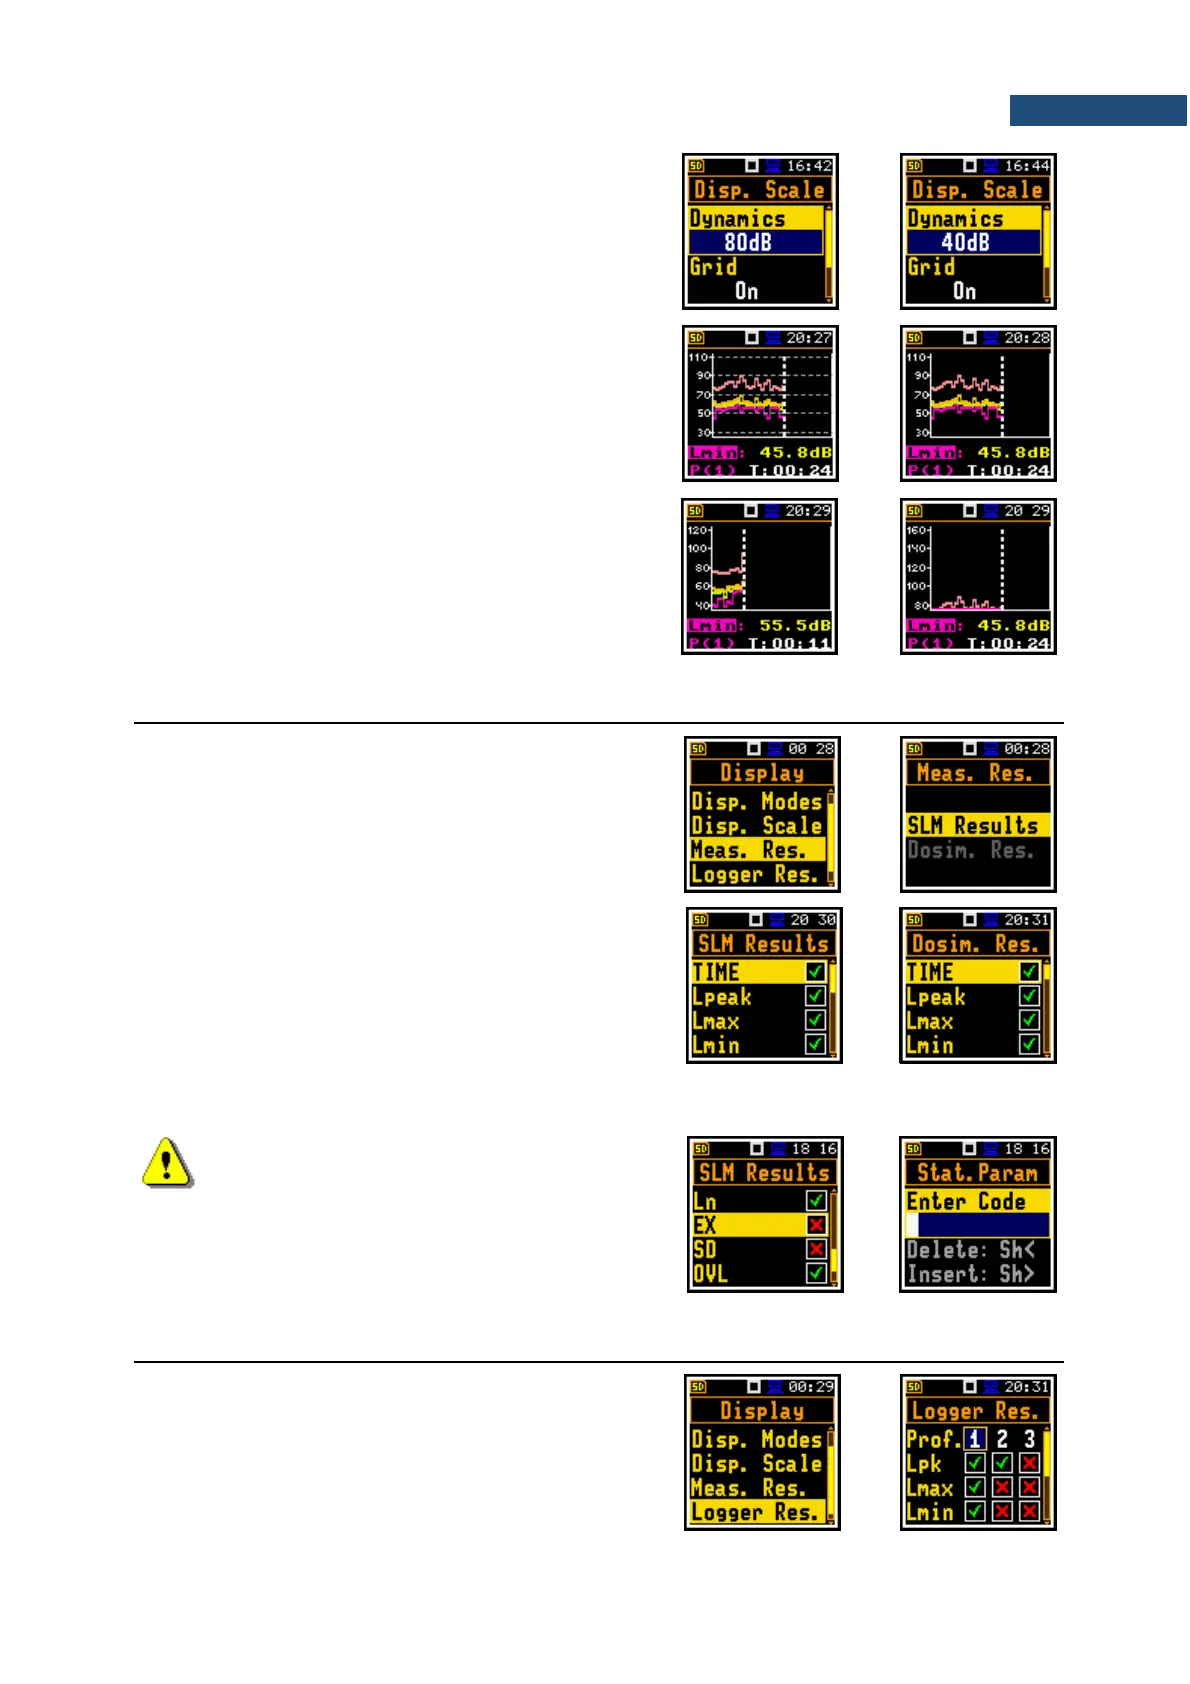
Scaling the vertical axis
The Dynamics position enables selecting the required
dynamic range of the plot (Y-axis). It is possible to select
the range from the set: 10dB, 20dB, 40dB, 80dB and
120dB.
Switching grid on/off
The Grid position enables switching On or Off the
horizontal grid lines of the plot.
Switching automatic Y-scale adjustment on/off
The Autoscale position switches On or Off the
automatic scale adjustment of the Y-axis. Adjustment is
made automatically as soon as the measurement is
started to match the scale to the microphone input level.
5.3 SELECTING MEASUREMENT RESULTS FOR PRESENTATION – MEASUREMENT RESULTS
The Meas. Res. position enables choosing the Sound
Level Meter (SLM Results) or Dose Meter
(Dosim. Res) measurement results, which will be
presented in different views.
The result can be selected from:
• SLM Results list: TIME, Lpeak, Lmax, Lmin, L,
Leq, LE, Lden, LEPd, Ltm3, Ltm5, Ln, LR1, LR2,
EX, SD, OVL;
• Dosim. Res. list: TIME, Lpeak, Lmax, Lmin, L,
DOSE, D_8h, PrDOSE, LAV, Leq, LE, SEL8, E,
E_8h, LEPd, PSEL, Ltm3, Ltm5, Ln, PTC, PTP,
ULT, TWA, PrTWA, Lc-a, EX, SD, OVL.
Note: The EX and SD results are optional and
should be unlocked by entering the activation
code in the text editor screen, which is opened
after first attempt to select them. Once
unlocked these results will be available
permanently.
5.4 CHOOSING LOGGER RESULTS FOR PRESENTATION – LOGGER RESULTS
The Logger Res. position enables choosing Logger
Results (time-history results), saved in the logger file,
which will be displayed in the Logger view.