12 Software description
CyFlow
®
Cube 8 | Operating Manual | May 2018 | Revision 032 73
View group
The View group contains options to modify the way in which plots are
displayed in the Plots area of the Workspace.
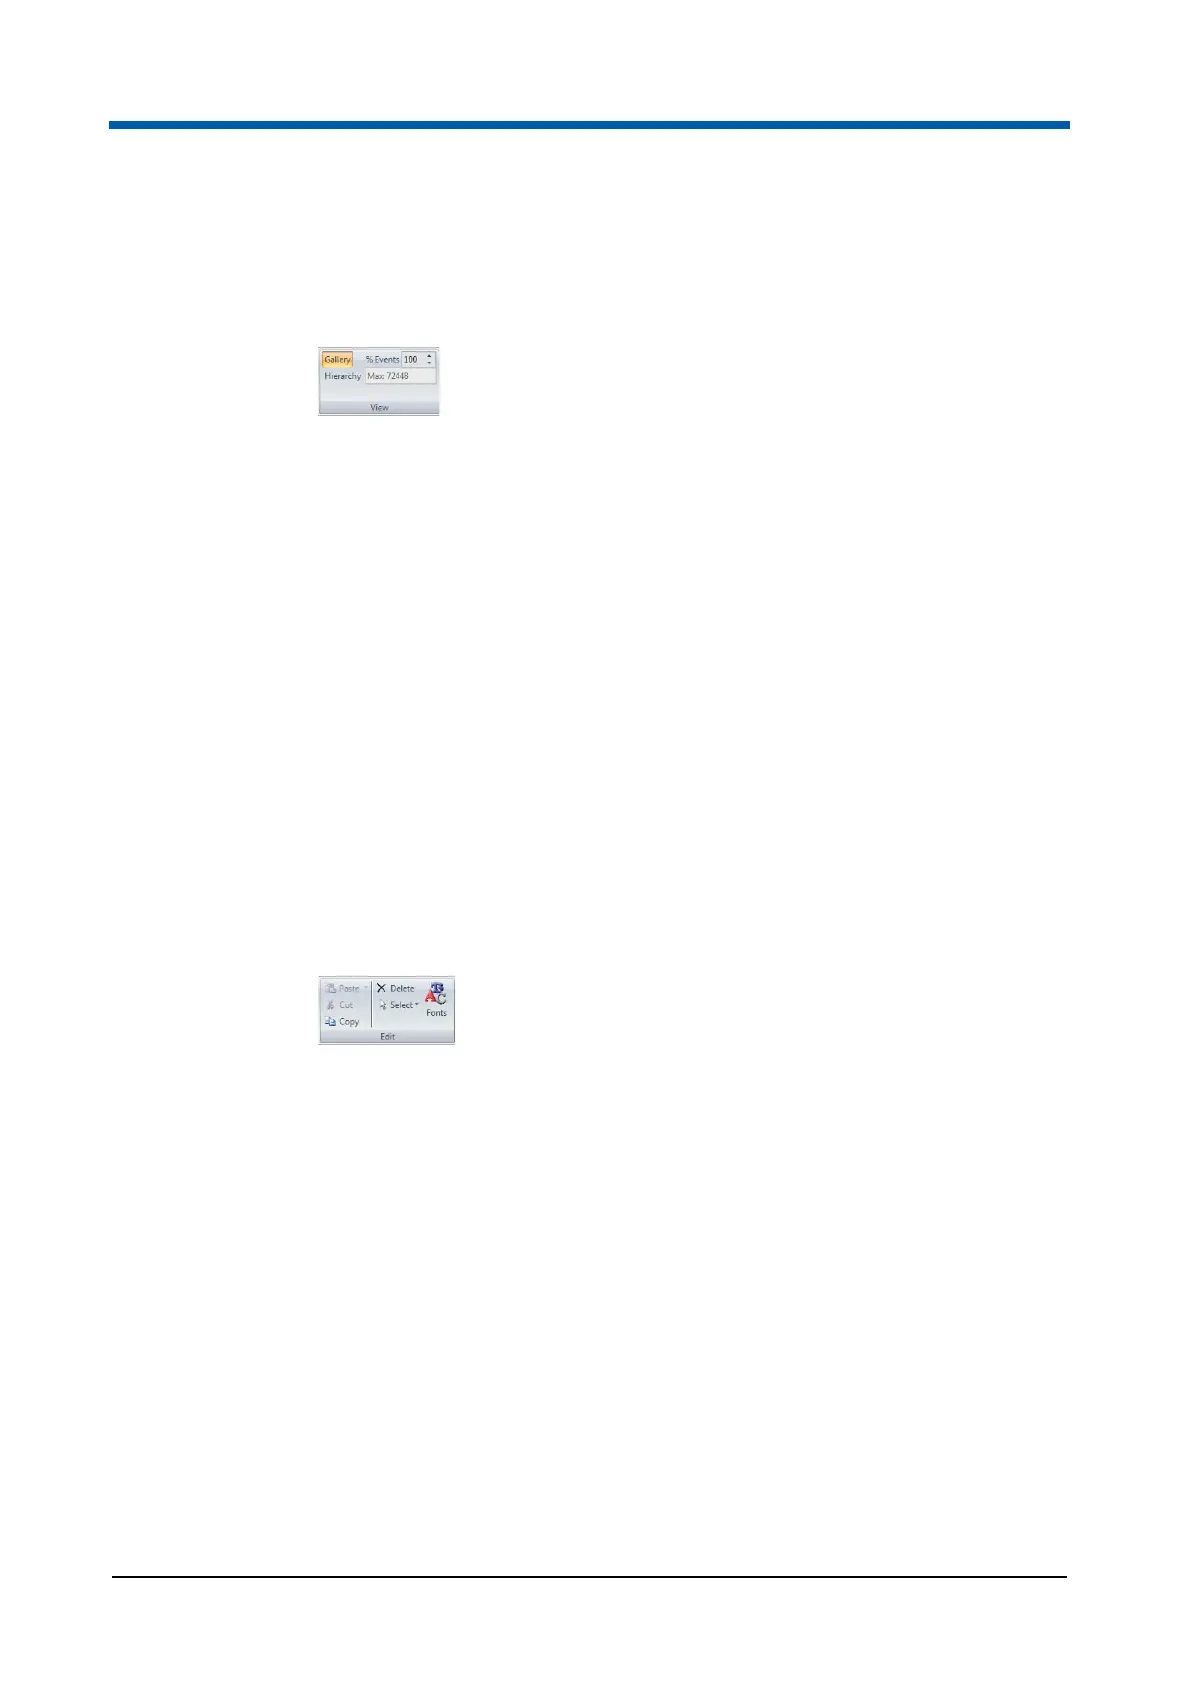
The View group contains the following options:
Gallery: Click the button to choose the Gallery plot view. The plots in the
Plots area are displayed next to each other.
Hierarchy: Click the button to choose the Hierarchy plot view. The plots
in the Plots area are displayed in a family tree style hierarchy format.
% Events: To reduce the number of events displayed on screen, enter a
value or use the up/down arrows to define the desired percentage of
events to be displayed. The actual number of events displayed is shown
in the "Max:" field below. Adjusting this value does not affect statistical
calculations which are always performed on all events within a file.
Edit group
The Edit group contains options for copying images of the currently selected
plots and statistics for pasting into other applications. These controls are
also used for copying, cutting and pasting items within reports. Additionally,
the fonts of text items in the current Workspace can be edited.
The buttons are only available if a Playlist item or a Worklist item is open in
the Workspace area.
The Edit group contains the following buttons:
Paste: Click the button to paste previously copied or cut report items
back into the report. The button is only enabled on the Reports tab of the
Workspace, after a report item has been copied or cut.
Cut: Click the button to cut the selected report item and place it on the
clipboard for pasting into the report. Report items cannot be pasted into
other applications. The button is only enabled on the Reports tab of the
Workspace, after a report item has been selected.
Copy: When on the Plots tab of the Workspace, click this button to copy
an image of the currently selected plot(s) or statistics. You can then
paste the item into other applications (Microsoft
®
Word, PowerPoint,
etc.).
If you want to maintain the hierarchy view when copying and pasting
plots displayed in the Hierarchy format, first select all plots in the
hierarchy and then click the Copy button. If all plots in the hierarchy are
not selected, when pasted, plots will be pasted in the standard Gallery
format.