12 Software description
68 CyFlow
®
Cube 8 | Operating Manual | May 2018 | Revision 032
12.4.3 Analyze tab
The Analyze tab provides controls for analysing and modifying the plots in
the Plots area of the Workspace.
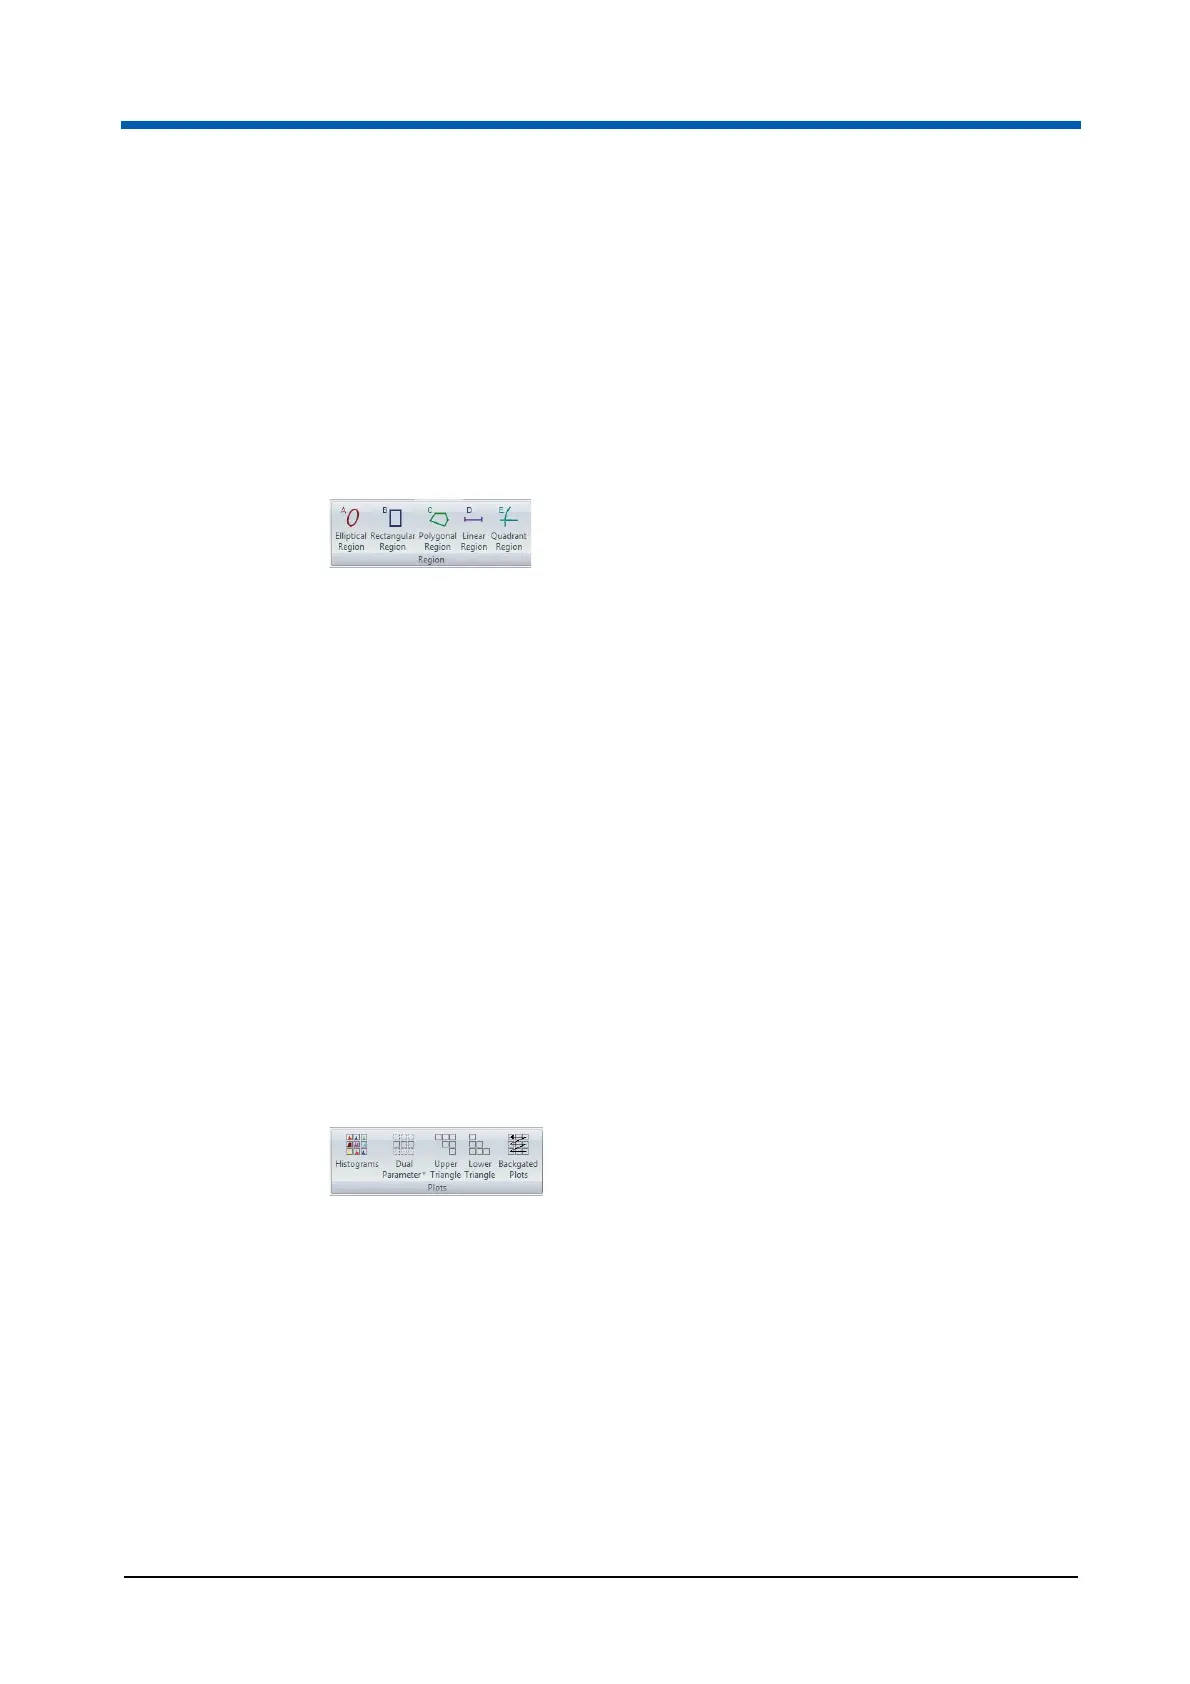
Region group
The Region group contains options for creating and editing regions. You can
create a maximum of 256 regions per Workspace. Once this number is
reached, the region creation buttons in the Region group become disabled.
The Region group contains the following options:
Elliptical Region: Click the button to preselect creating an elliptical
region on a dual parameter plot.
Rectangular Region: Click the button to preselect creating a rectangular
region on a dual parameter plot.
Polygonal Region: Click the button to preselect creating a polygonal
region on a dual parameter plot.
Linear Region: Click the button to preselect creating a linear region on a
single parameter plot.
Quadrant Region: Click the button to preselect creating a quadrant
region on a dual parameter plot.
For further information on defining and editing regions, see chapter Creating
regions on page 165.
Plots group
The Plots group contains options for adding a specific selection of plots to
the Plots area of the Workspace.
The Plots group contains the following buttons:
Histograms: Click the button to add all the single parameter histogram
plots displayed in the Previews area of the Workspace to the Plots area.
The plots are gated with the same gate as the preview plots. All the
added plots are colour-coded to illustrate the gating applied to the
Previews area.
Dual Parameter: Click the button to display a drop-down list of available
parameters. Select a parameter from the drop-down list to add all the
dual parameter combinations against this parameter to the Plots area.
The selected parameter is fixed as the Y-axis. The plots are gated with
the same gate as the preview plots. All the added plots are colour-coded
to illustrate the gating applied to the Previews area.