12 Software description
CyFlow
®
Cube 8 | Operating Manual | May 2018 | Revision 032 171
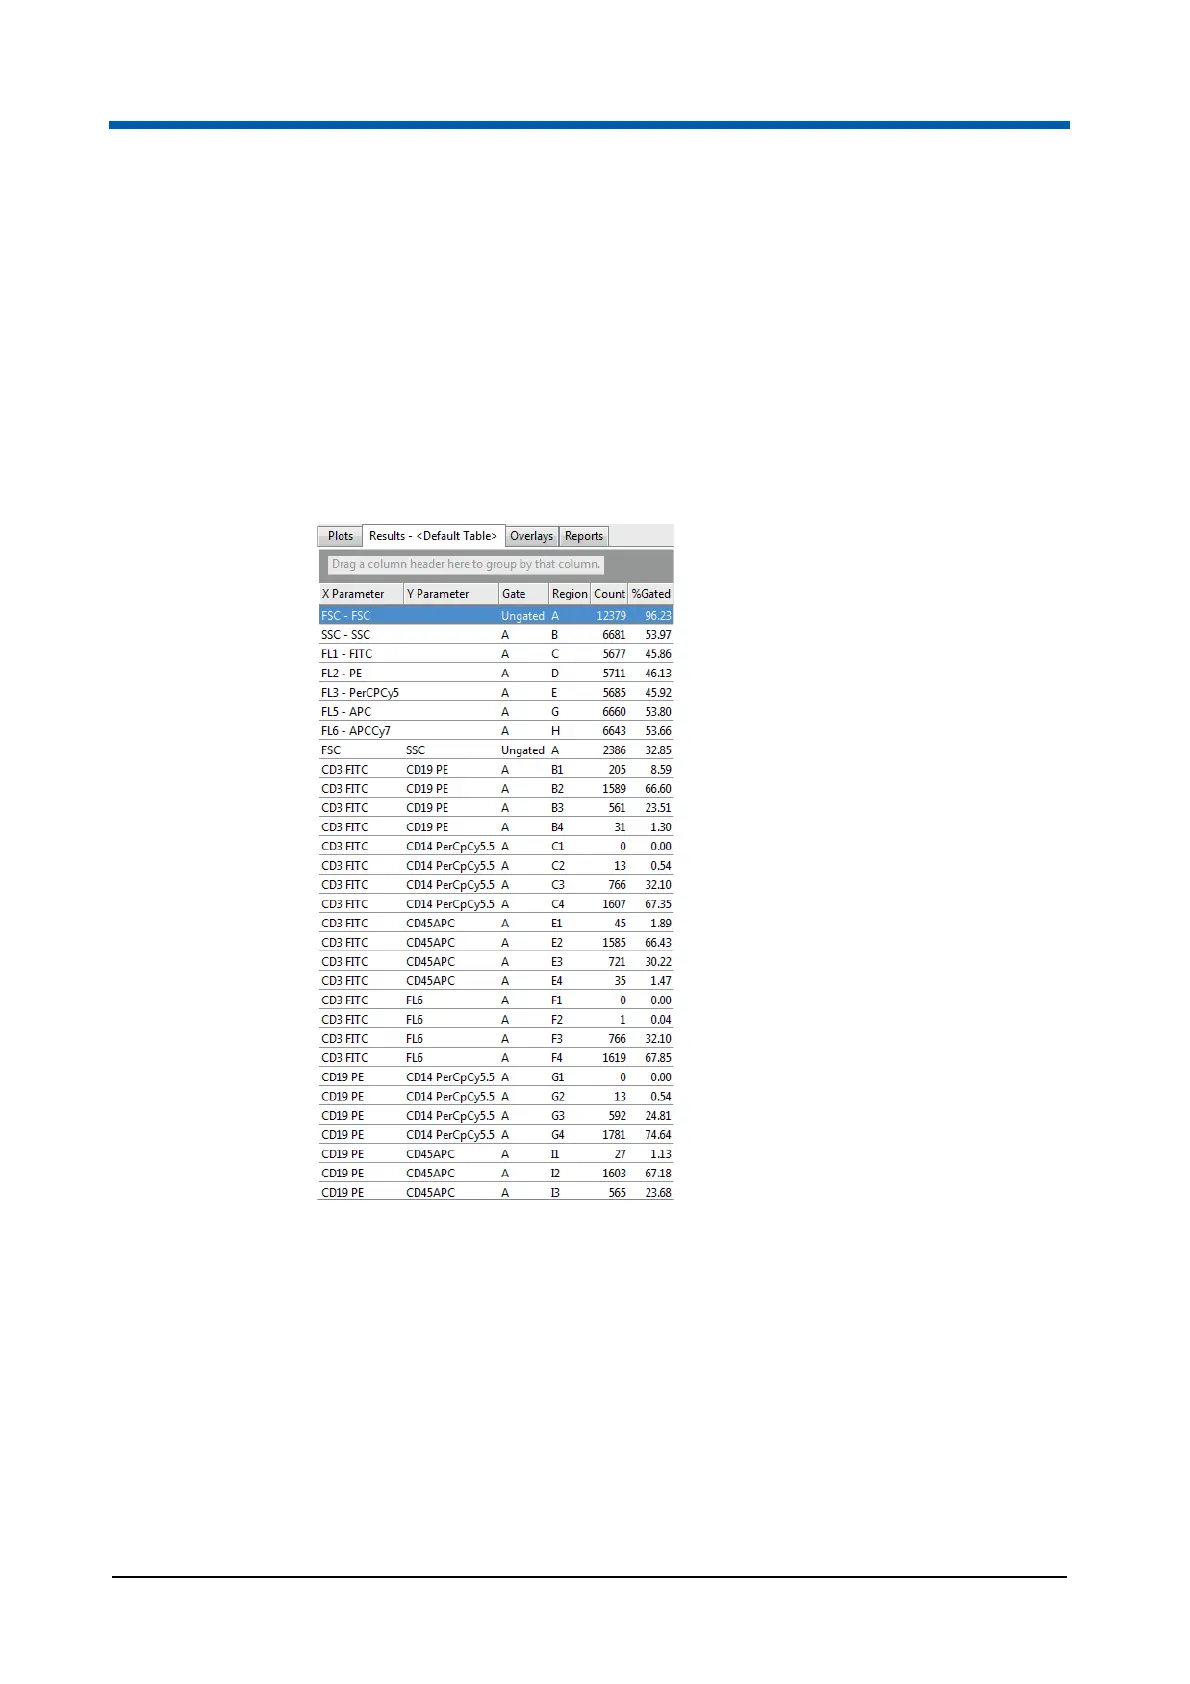
12.8.2 Results tab of the Workspace
In the Results tab of the Workspace, a results table is displayed. Here, you
can view statistics associated with the current Playlist or the current Worklist
pane. You can copy statistics for use in other applications, export statistics to
CSV and XML files and print statistics using the options on the File tab of the
Ribbon.
When you switch to the Results tab of the Workspace, the Ribbon
automatically switches to its Statistics tab providing the options to select the
statistics for the results table.
Results table rows and columns
A results table generates result rows based on regions, plot gates (if
selected) and derived gates from all items in a Playlist or from all items in the
current panel of a Worklist which have a listmode file. Each region created in
the Workspace generates a row in the results table. For a quadrant region,
four rows are created, one for each quadrant. Each DNA cell cycle plot also
generates a results row in the table.
The columns in the results table represent the individual statistics as
selected from the Statistics tab of the Ribbon (see chapter 12.4.7 Statistics
tab on page 92). For a cell cycle plot, an additional "Error Message" column
is added to the results table. The message reported by the cell cycle