12 Software description
CyFlow
®
Cube 8 | Operating Manual | May 2018 | Revision 032 179
of the selected plots already exist in the target overlay plot, any new plots
will be added but all selected plots will be removed from the current plot.
Copy selected Plot(s) to Overlay Plot takes a copy of the selected
plots and adds them to a new selected overlay plot. If all of the selected
plots already exist in an overlay plot, that overlay plot is greyed out in the
list. If some of the selected plots already exist in the target overlay plot,
any new plots will be added but existing plots will not be added to the
target overlay plot.
12.8.4 Reports tab of the Workspace
In the Reports tab of the Workspace, you can create page-based reports
from a Playlist or from a panel of a Worklist. Reports can be used to create a
customised page-based summary of plots, statistics and other information. A
report can comprise up to 800 pages.
In Playlist mode, there is a single report per Playlist. In Worklist mode, there
is a single report per panel of the Worklist.
On selecting the Reports tab in the Workspace, a blank report page is
displayed. The Report tab of the Ribbon automatically becomes active
providing options to edit the report (see chapter 12.4.12 Report tab on
page 114).
Reports are created by inserting objects into the report page. Objects can be
inserted via the Insert group on the Report tab of the Ribbon or sent to the
report from the Plots tab of the Workspace.
In Playlist mode, you can also use the Report Wizard on the Report tab of
the Ribbon to create reports.
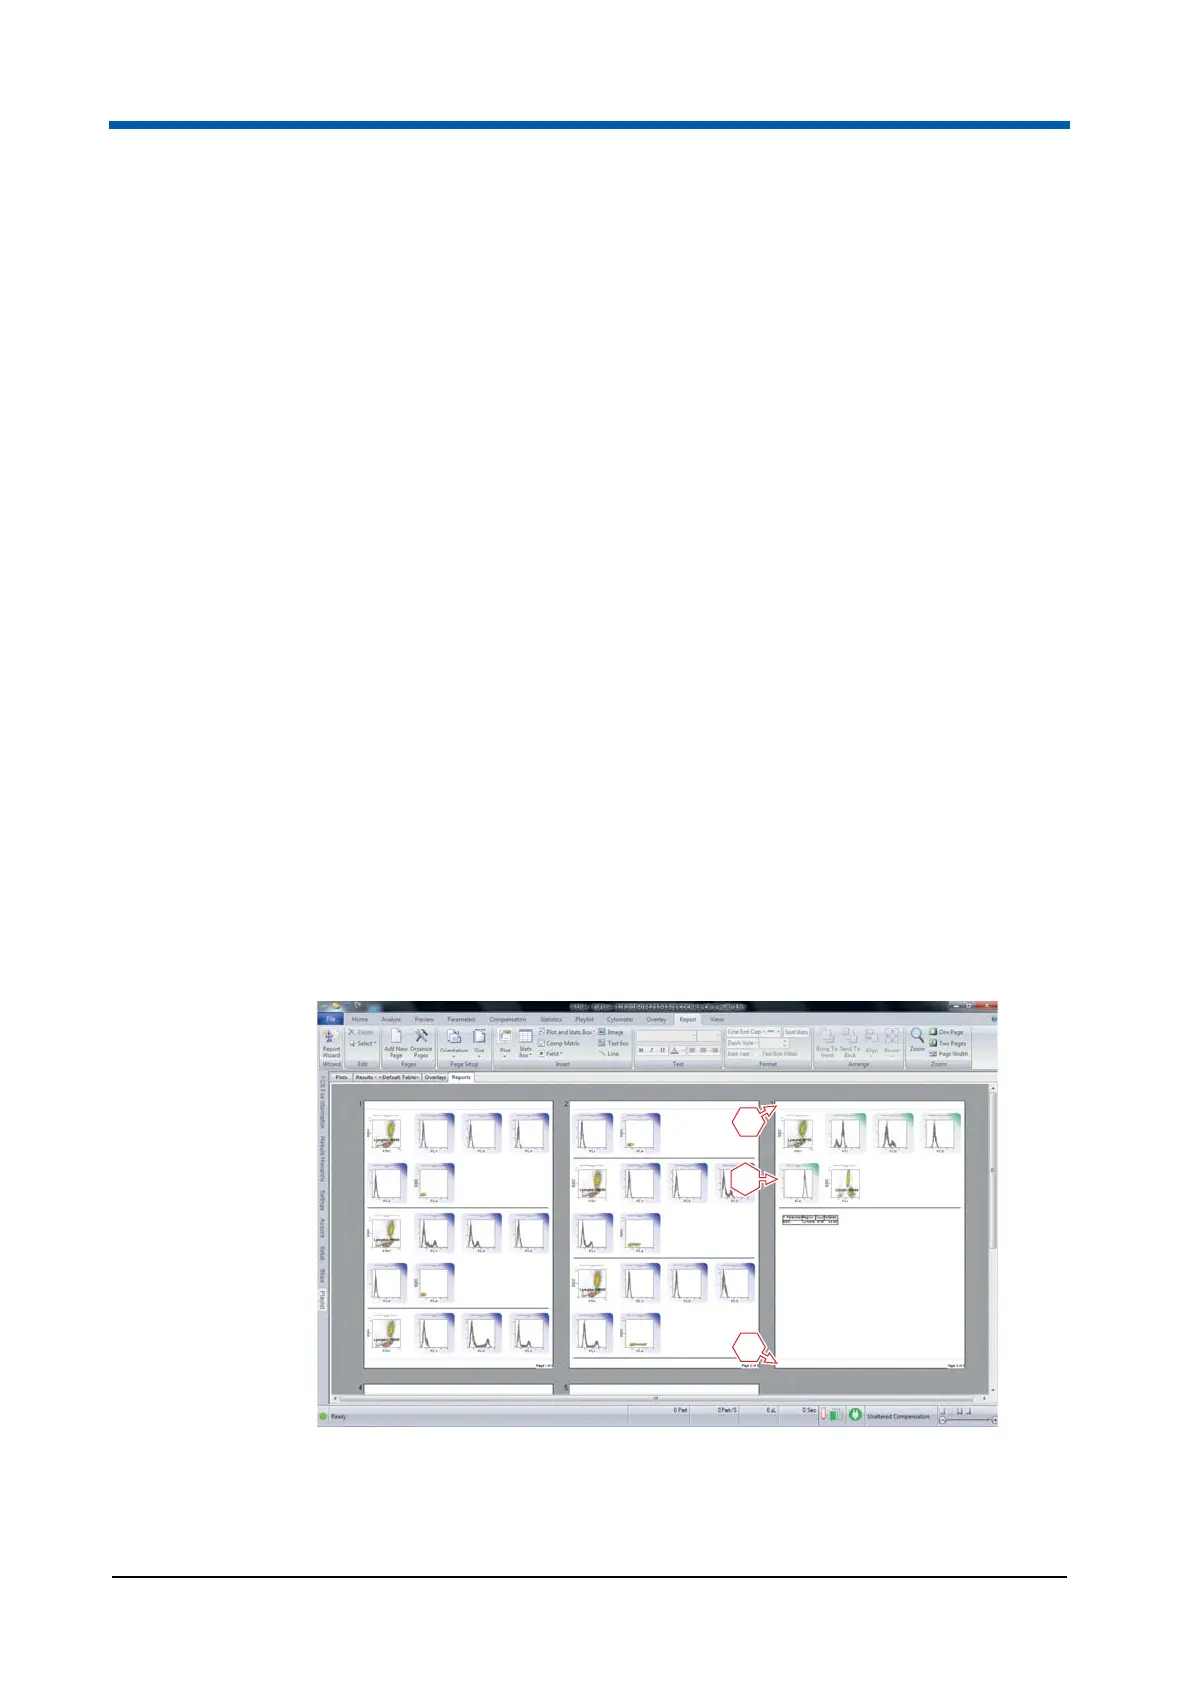
1 Header of a report page
2 Body of a report page
3 Footer of a report page