12 Software description
178 CyFlow
®
Cube 8 | Operating Manual | May 2018 | Revision 032
Sending plots to the report
To send plots to the report, select the desired plots in the Overlays area or
the Galleries area, right-click and select the "Send selected Plot(s) to Report"
option. The currently selected plots are sent to a new page at the end of the
current report. For information on reports, see chapter 12.8.4 Reports tab of
the Workspace on page 179.
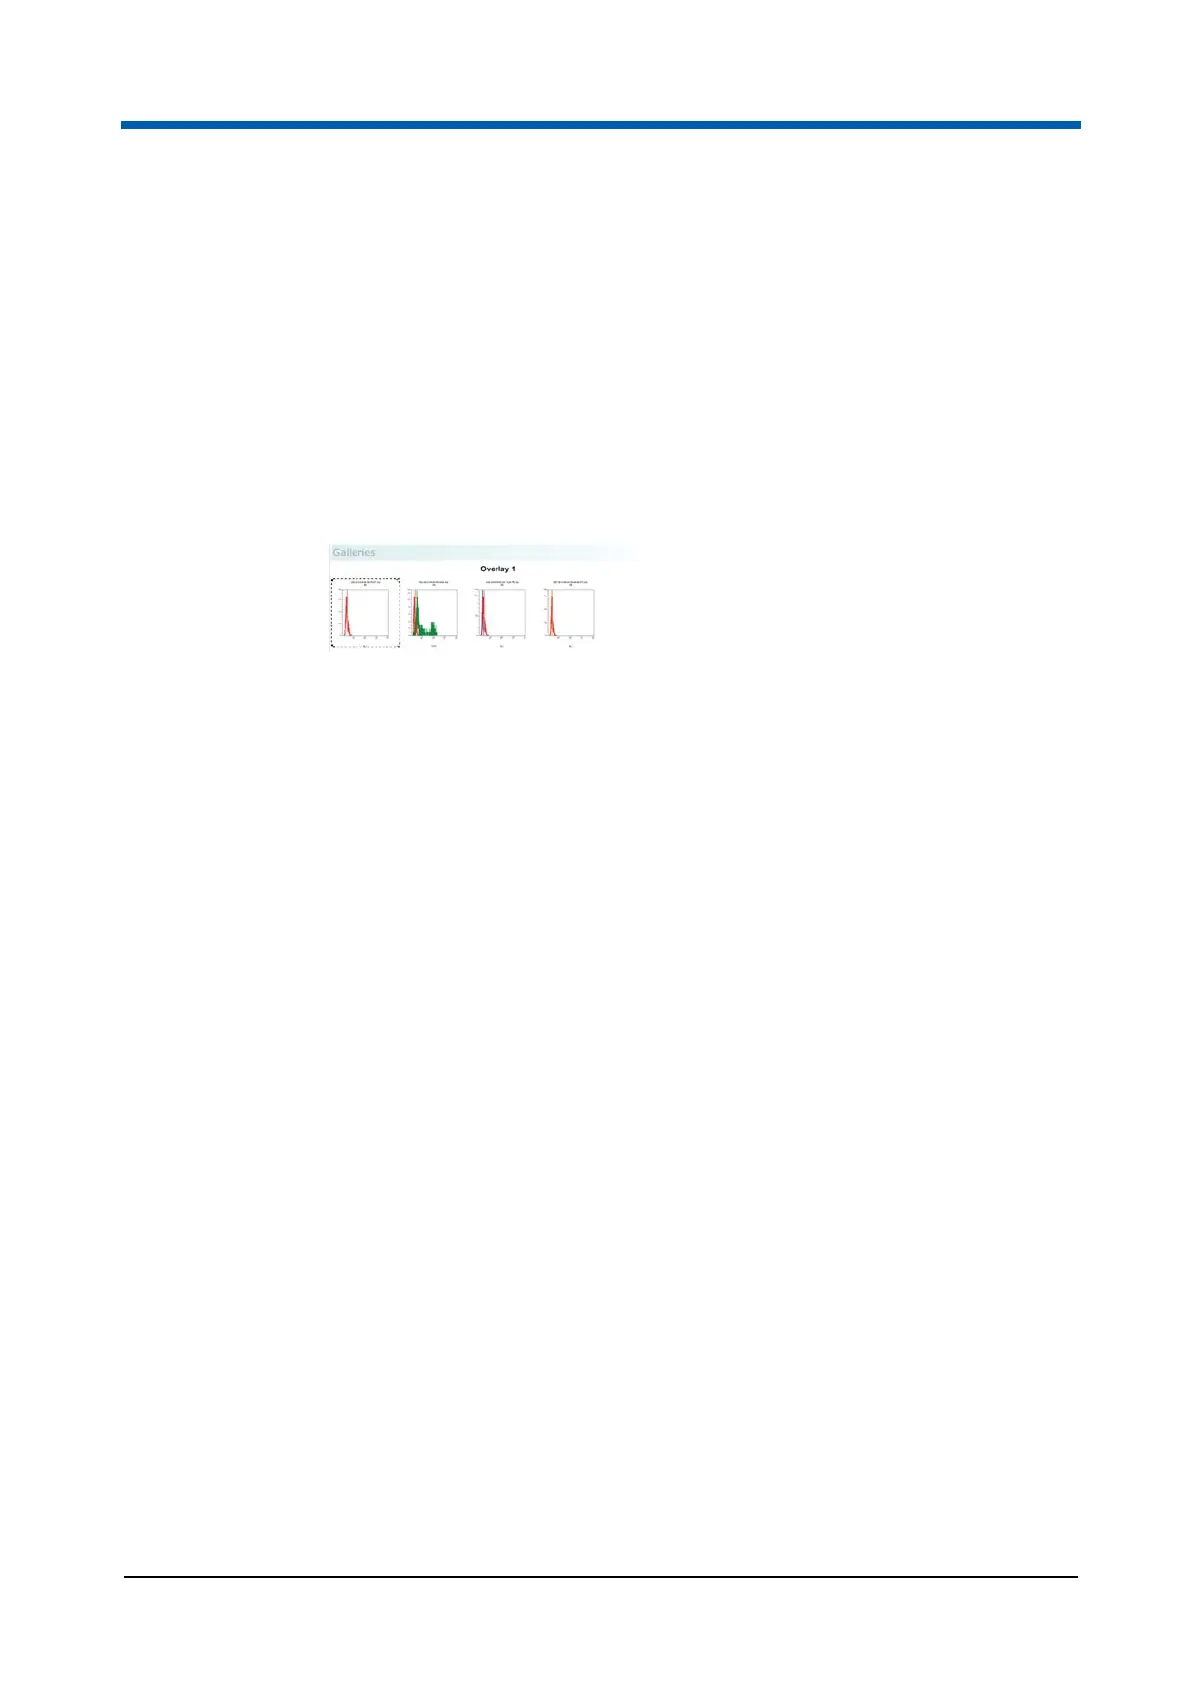
Using control plots
Single parameter gallery plots can be selected to be control plots. A control
plot is displayed on all the plots in its gallery.
To define a control plot, select the plot from the Galleries area and right-click
to open the context menu.
The following options are available:
Set as Control Plot is available when a single gallery plot is selected.
Select the option to display the plot as a control on all gallery plots of the
current overlay plot. The gallery plot set as a control displays a dashed
border.
If a control plot is already set, selecting another plot as a control will
replace the currently set control with the new selection on all plots within
the gallery.
Remove Control Plot is available when a plot is set as a control for the
gallery. This option removes the control plot from all plots in the gallery.
Control in Front is available when a plot is set as a control for the
current gallery. Select this option to display the control plot in front of the
plot data. Deselect the option to display the control plot in the
background of the plot data.
Alternatively, the buttons in the Controls group of the Overlay Format tab of
the Ribbon can be used (see chapter Controls group on page 134).
Moving and copying plots from the Galleries area to an overlay plot
To add plots to an overlay plot from the Galleries area, select the plot(s) from
the Galleries area and right-click to open the context menu.
The following options are available:
Move selected Plot(s) to Overlay Plot moves the currently selected
plots to a new selected overlay plot. If all of the selected plots already
exist in an overlay plot, that overlay plot is greyed out in the list. If some