12 Software description
174 CyFlow
®
Cube 8 | Operating Manual | May 2018 | Revision 032
The information displayed in the groups can be collapsed and expanded by
clicking the +/- buttons.
A column header can be removed from the grouping by dragging it back to
its position in the results table. When a column header is dragged back to
the results table, two red arrows indicate where the header will be placed.
The header can also be dragged off the table and it will be removed from the
group control.
12.8.3 Overlays tab of the Workspace
In the Overlays tab of the Workspace, you can create overlay plots of single
or dual parameter plots. Overlay plots can be used to compare plots.
In Playlist mode, there is an overlay Workspace per Playlist. In Worklist
mode, there is an overlay Workspace per panel.
On selecting the Overlays tab in the Workspace, a blank area is displayed.
The Overlay tab of the Ribbon automatically becomes active providing
options to edit the overlay Workspace (see chapter 12.4.11 Overlay tab on
page 109).
Overlay plots are created by sending plots from the Plots tab of the
Workspace to the Overlays tab.
In Playlist mode, you can also use the Overlay Wizard on the Overlay tab of
the Ribbon to create overlay plots.
Each overlay consists of an overlay plot and an associated gallery of its
source plots. An overlay can contain a maximum of 400 source plots.
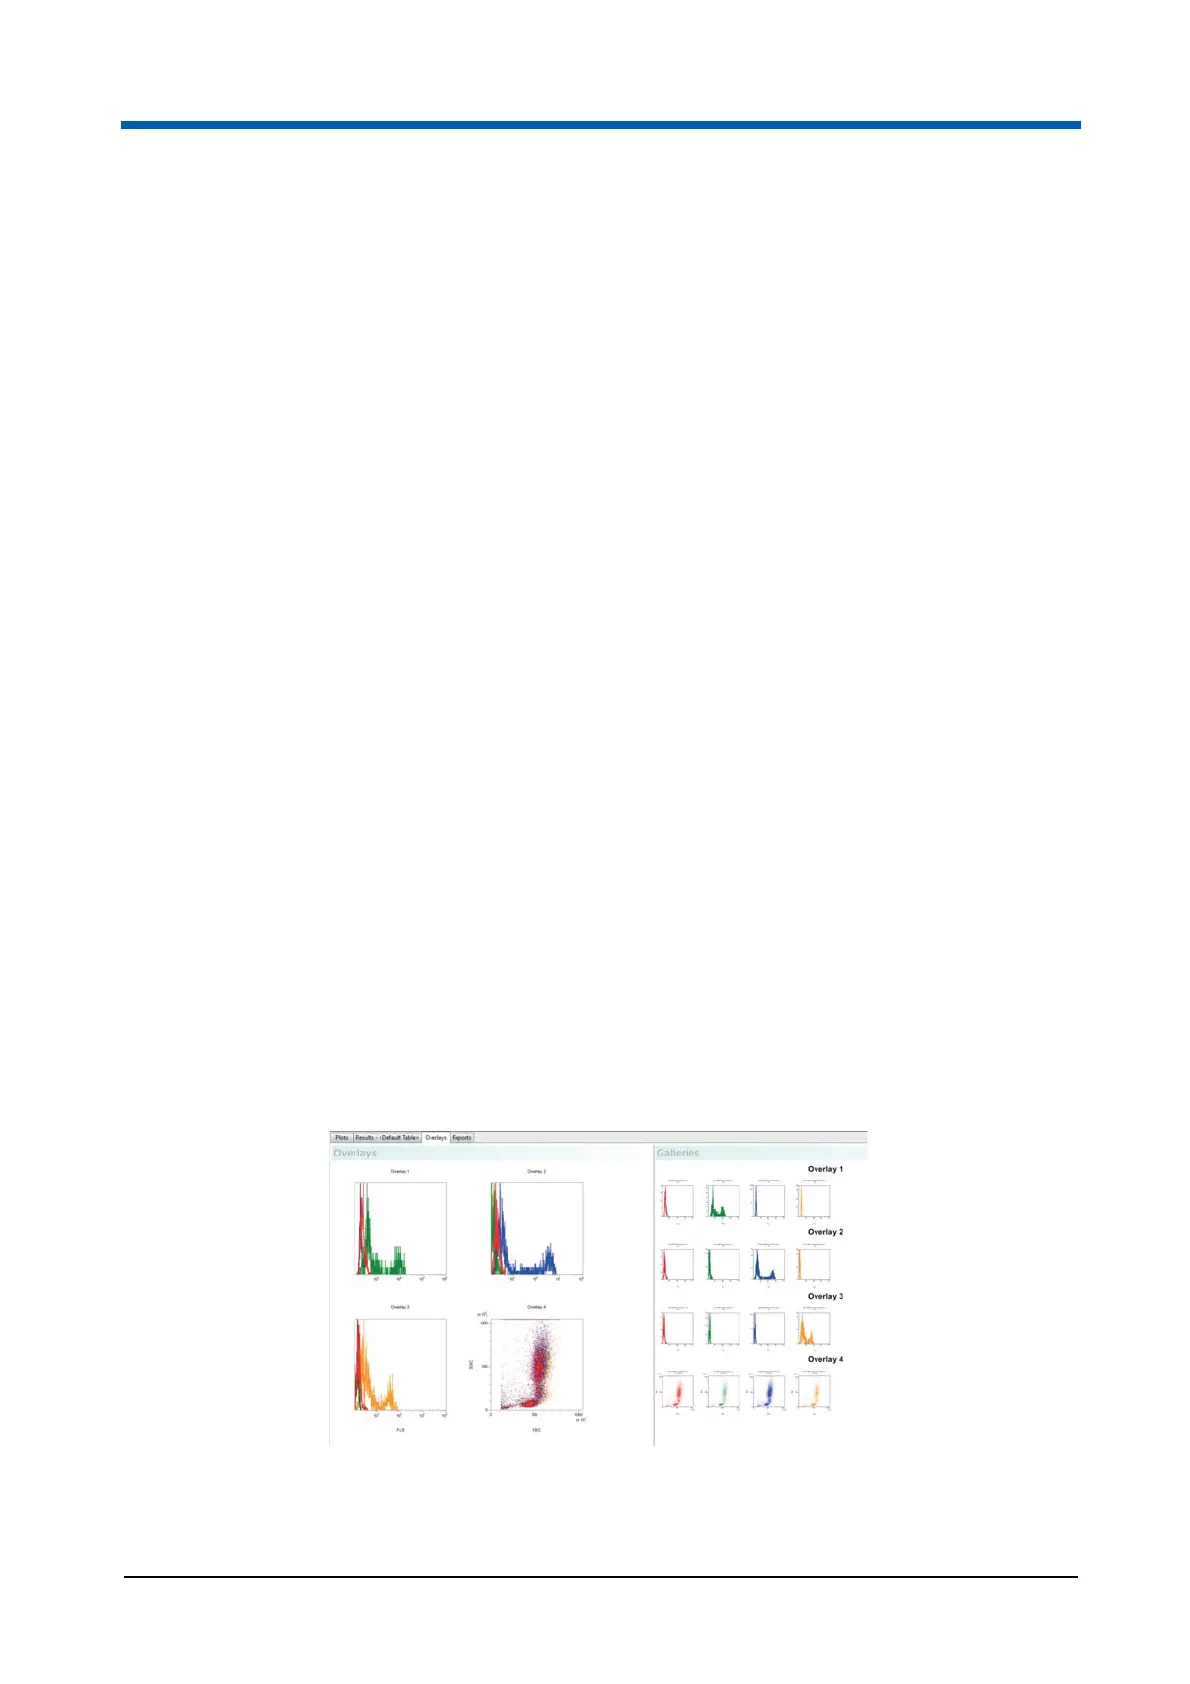
The Overlays tab of the Workspace consists of two areas:
The Overlays area displays a 2D or 3D view of available overlay plots.
The Galleries area displays the individual source plots that make up the
overlay plots. For each overlay plot, a gallery of individual plots is
displayed with the name of the overlay plot as a title.