12 Software description
CyFlow
®
Cube 8 | Operating Manual | May 2018 | Revision 032 165
When flipping a plot containing a quadrant region, the quadrant dividers
are flipped, but the names of the quadrants are persisted. Any gate
equations using these quadrant regions will be updated if required.
Any linking of regions will be removed if you flip plot axes. In this case, a
warning message will be displayed and you will have the option to cancel
flipping the axes.
Alternatively, use the "Parameters" options of the Home tab to change
the parameters of selected plots (see chapter Parameters group on
page 66).
Creating regions
Regions can be defined on single or dual parameter plots. The maximum
number of regions that can be created in a Workspace is 256. Quadrant
regions are not included in this count.
Regions are created using the buttons in the Region group on the Home tab
(see chapter Region group on page 65) or on the Analyze tab (see chapter
Region group on page 68).
To create a region on a plot, click the required region type button. The button
is highlighted. Then either click on a plot to set the region at the default size,
or draw out the required region size on the desired plot.
To cancel the creation of a region, press the Esc key before or during the
dragging of that region.
Once the maximum number of 256 regions is reached, the buttons in the
Region group become disabled.
Only one region can be drawn per button selection for the Elliptical,
Rectangular and Polygonal region types. Linear regions can be applied to
multiple selected single parameter plots by pressing the Ctrl key while
clicking to add the region. Quadrant regions can be applied to multiple
selected dual parameter plots by pressing the Ctrl key while clicking to add
the region.
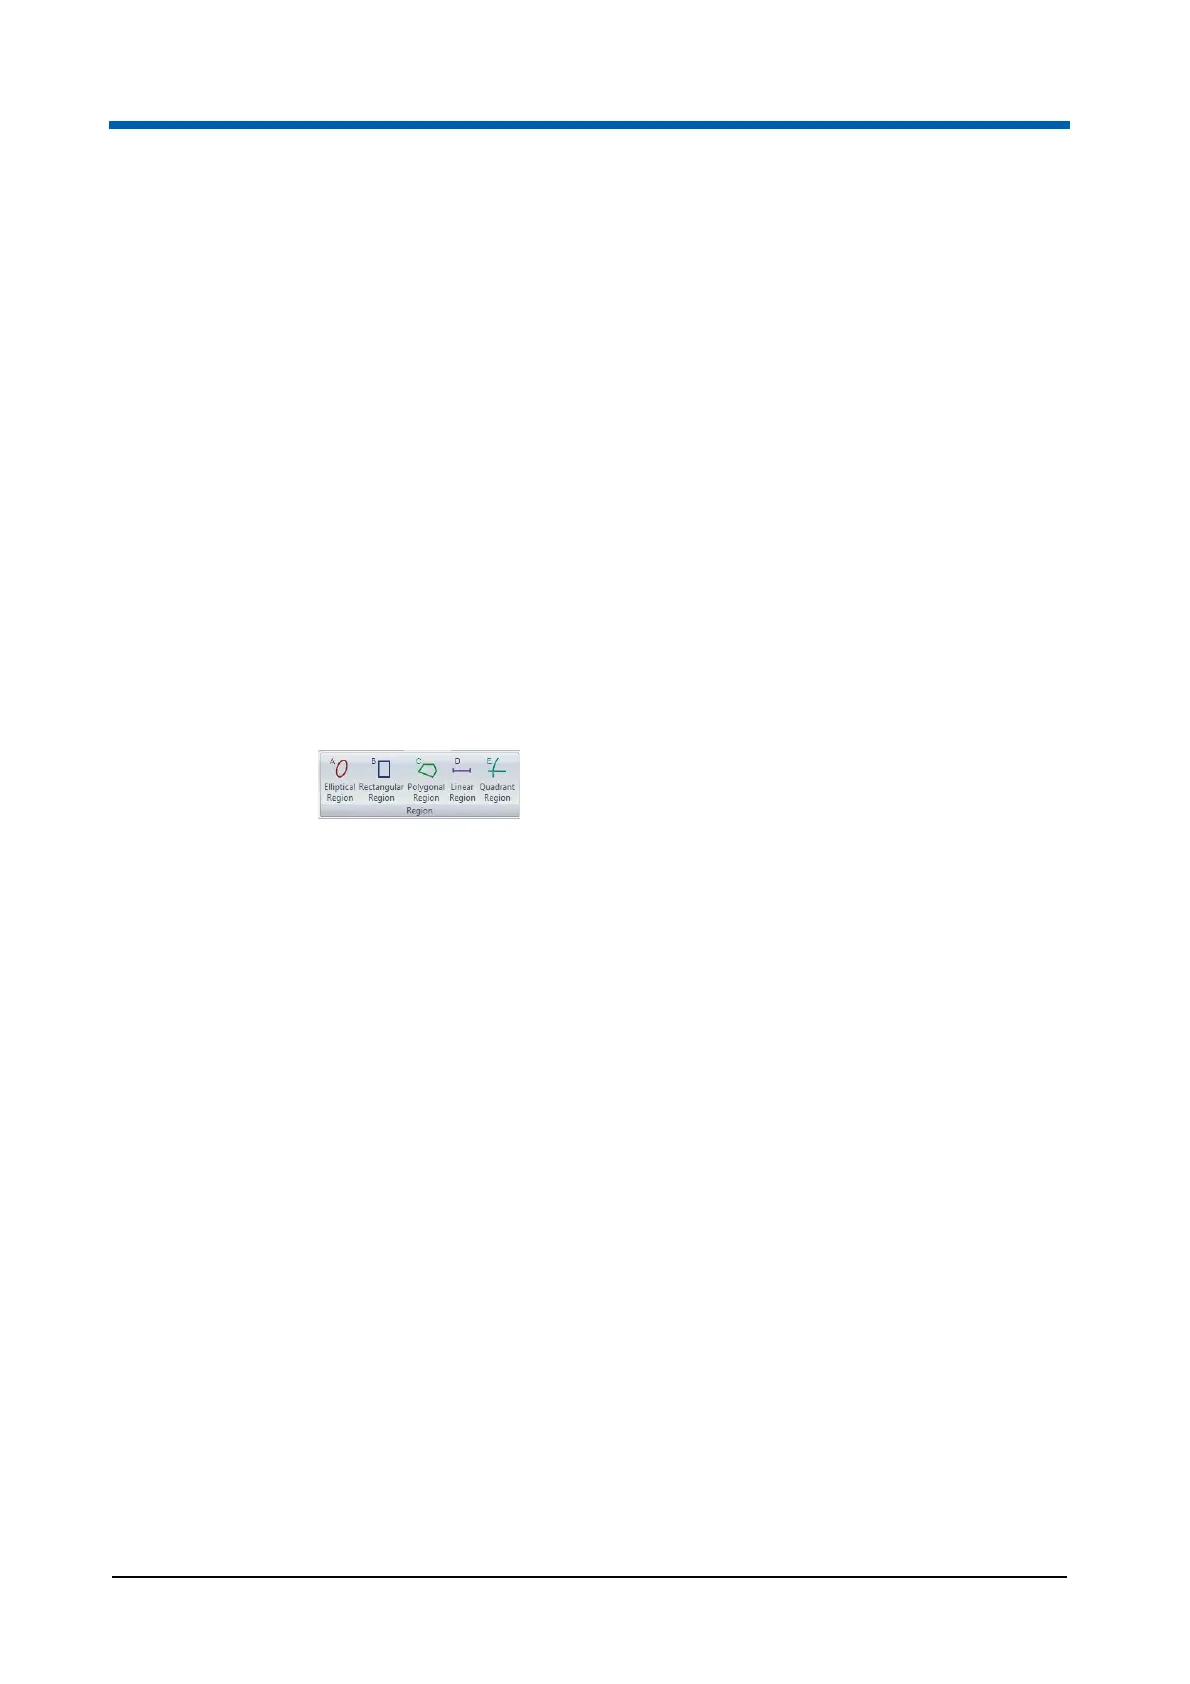
To create a region on a plot, first click the required region type button on the
Home tab or the Analyze tab. Five region types can be created:
Elliptical Region: Click the region type button. Then either click on a
dual parameter plot to set an ellipse of the default size, or draw out the
required ellipse on the desired plot.
Rectangular Region: Click the region type button. Then either click on a
dual parameter plot to set a rectangle of the default size, or draw out the
required rectangle on the desired plot.
Polygonal Region: Click the region type button. Click onto a dual
parameter plot to determine the first point of the region. Then click on the
plot to add additional points to the polygon. The polygon is then