Creating and Using Math Waveforms
3- 214
CSA7000B Series & TDS7000B Series Instruments User Manual
Overview Related control elements and resourcesTo define a spectral math waveform (Cont.)
Take cursor
measurements
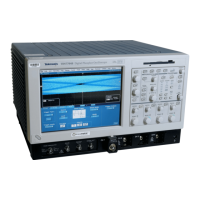
27. From the toolbar, touch the Cursor button to display the
cursors and the cursor control window.
28. Select the Math tab and touch the numbered button for
the spectral waveform that you want to measure.
29. Select the cursor type by touching either the H Bars, V
Bars, Waveform, or Screen buttons (for more
information, see Taking Cursor Measurements starting
on page 3--151).
30. Turn the multipurpose knobs to position each cursor on
the waveform to measure the feature that interests you.
31. Read the results in the cursor readout.
The cursor readout is displayed below the graticule as
shown here or at the bottom of the graticule area.
The figure shows the cursor measurement of a
frequency magnitude on an FFT. The readout reads
about 0 dB (4.0 mdB) because it is aligned with the
reference level offset. The other readout reads
--10.08 dB indicating the magnitude of the frequency it is
measuring is --10.08 dB relative to reference level offset.
Display of the source waveform is turned off.
The cursor units will be in dB or volts for magnitude
waveforms and in degrees or radians for those
measuring phase.
32. Select V Bars, and use the multipurpose knobs to align
the two vertical cursors to points of interest along the
horizontal axis of the waveform.
33. Read the frequency difference between the cursors from
the Δ: readout. Read the frequency of each cursor
relative to the zero frequency point from the cursors
readout.
For further
assistance
34. Touch the Help button in the toolbar to access
context-sensitive help on math waveforms.
See Accessing Online Help on page 3--263 for an
overview of the online help system.