Acquiring Waveforms
3-26
CSA7000B Series & TDS7000B Series Instruments User Manual
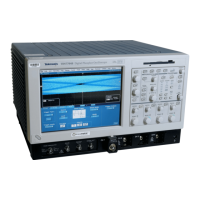
Table 3- 1: Additional resolution bits (Cont.)
Sample Rate (S/s)
Resulting effective
bits
Theoretical en-
hancement (bits)
Nd (extra samples)
5.00E+06 2.50E+02 3.98 9.98
1.00E+07 1.25E+02 3.48 9.48
2.50E+07 5.00E+01 2.82 8.82
5.00E+07 2.50E+01 2.32 8.32
1.00E+08 1.25E+01 1.82 7.82
2.50E+08 5.00E+00 1.16 7.16
5.00E+08 2.50E+00 0.66 6.66
1.25E+09 1.00E+00 0.00 6.00
H Envelope. Continuously, as subsequent waveforms are acquired, the
instrument retains the running minimum (Min) and maximum (Max) values
in adjacent sample intervals, creating an envelope of the number of
waveforms that you specify. Once the specified number of waveforms is
reached, the data is cleared and the process starts over. This is similar to the
Peak Detect mode, but Envelope mode, unlike Peak Detect, gathers peaks
over many trigger events.
H Average. The instrument processes the number of waveforms that you
specify into the acquired waveform, creating a running average of the input
signal. This mode reduces random noise.
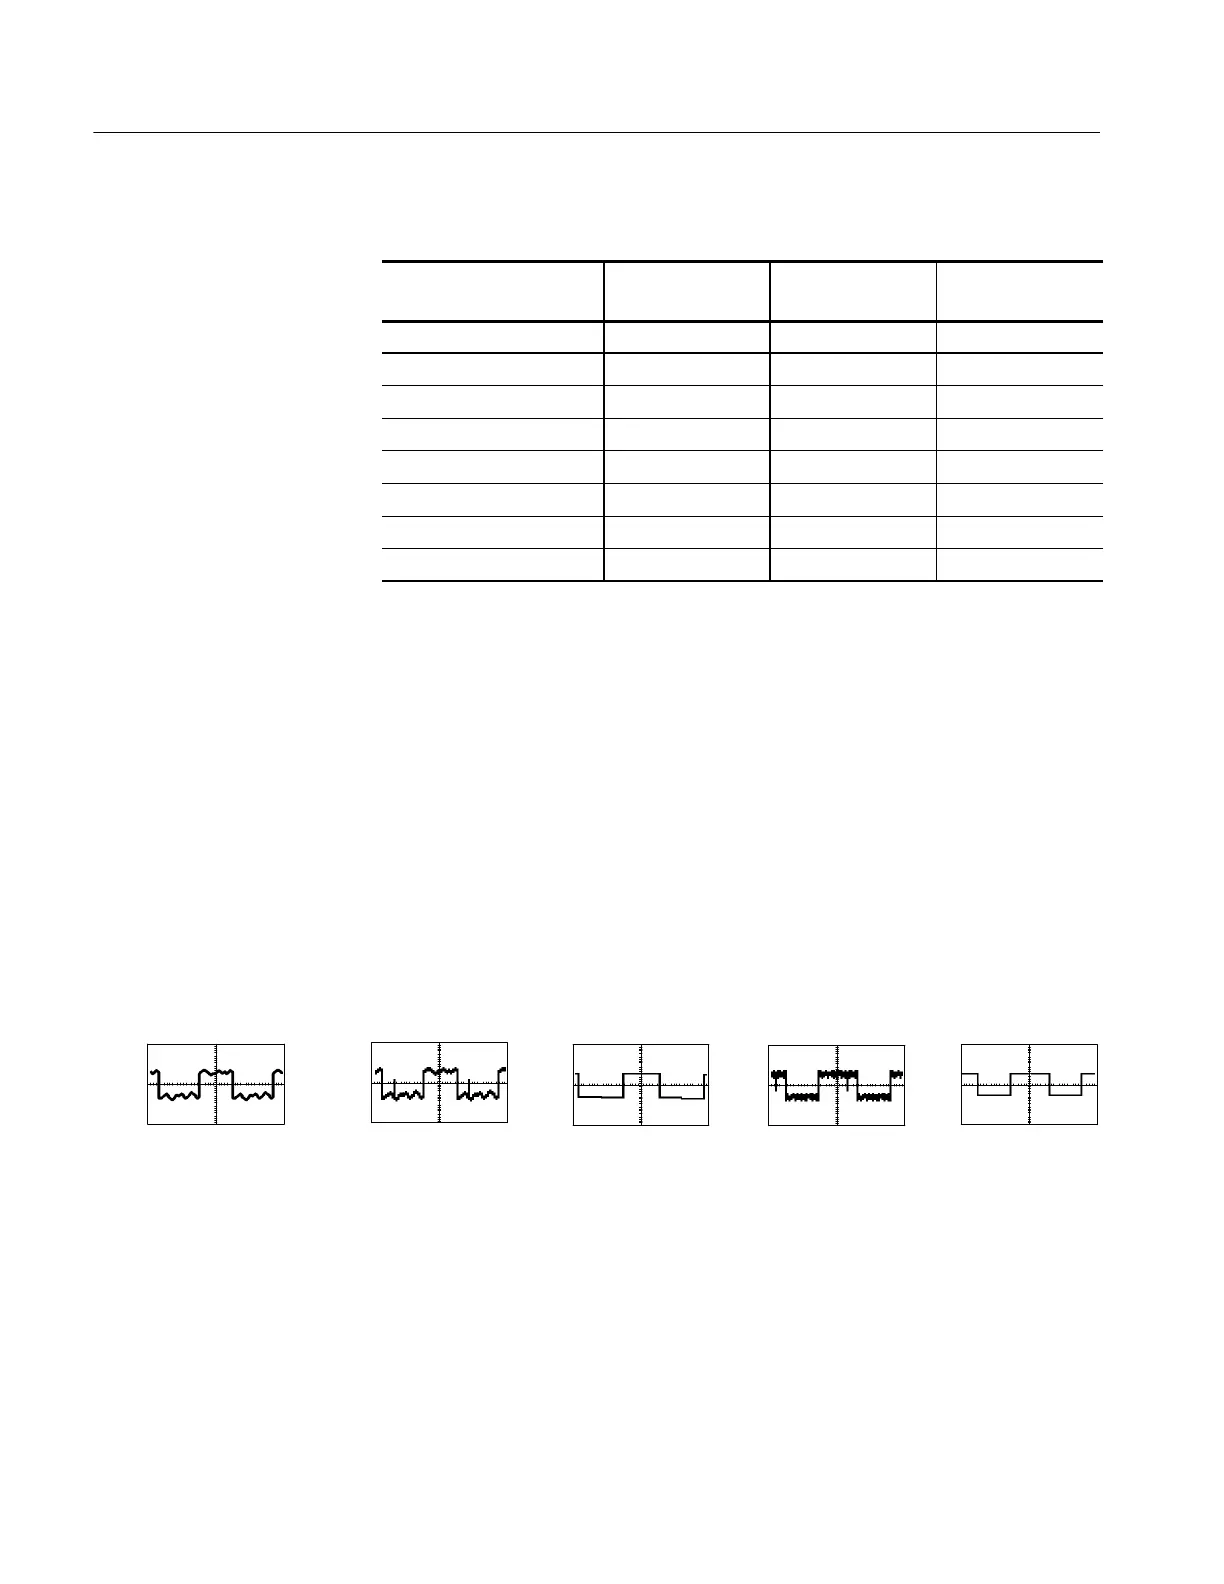
Acquiring and displaying a noisy square wave signal illustrates the difference
between the modes. Note how Average reduces the noise while Envelope
captures its extremes:
Sample
Envelope
AveragePeak Detect Hi Res
H Waveform Database. Using waveform database technology, the instrument
processes a much larger sample of data. The waveform database is a
three-dimensional accumulation of source waveform data over several
acquisitions. In addition to amplitude and timing information, the database
includes a count of the number of times a specific waveform point (time and
amplitude) has been acquired. The database is 200 lines by 500 columns
with a 64 bit counter for each pixel location. You can use color-graded
displays based on counts to highlight waveform activity. Parametric