9.WAVEFORM DISPLAY
71
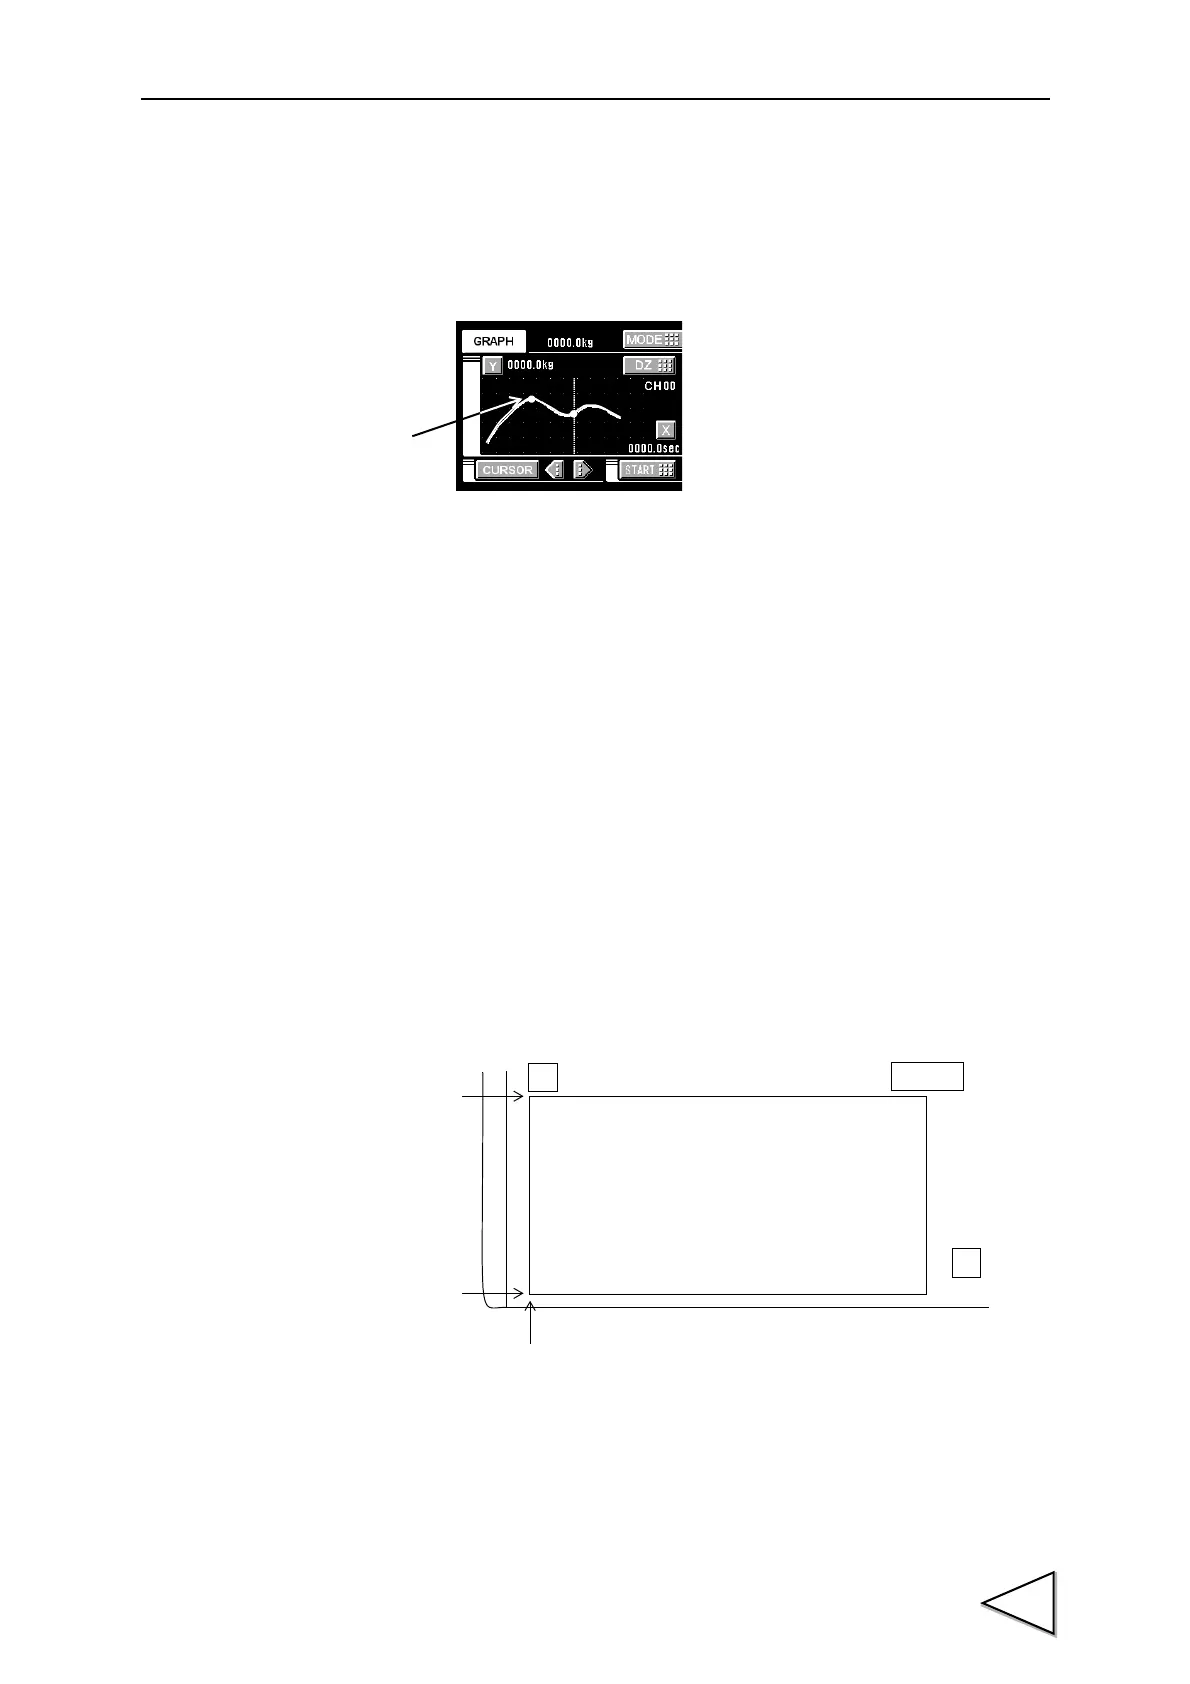
9-1-1. Hold Point Plotting
By using the hold function and the graph plotting function together, the held point (red)
can be plotted.
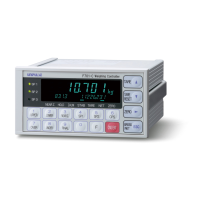
9-1-2. X-axis and Y-axis on the Graph Plotting Screen
X-axis
The X-axis is a time setting axis. One graph screen is plotted between the start signal
input point and the X start point.
There are 200 plotting points, and typical values for the predetermined time divided by
this number of plotting points are plotted.
Y-axis
The Y-axis is a load setting value. A graph is plotted between the Y start point and the Y
end point. (There are 100 plotting points.)
Held
point
Example) Relative maximum hold
Plotting Range
D Z
100
Y
X
200
X End Point
Y End Point
Y Start Point
0