General Operation
TVM Series Installation and Operation Handbook 95
Copyright © 2008, Harris Corporation
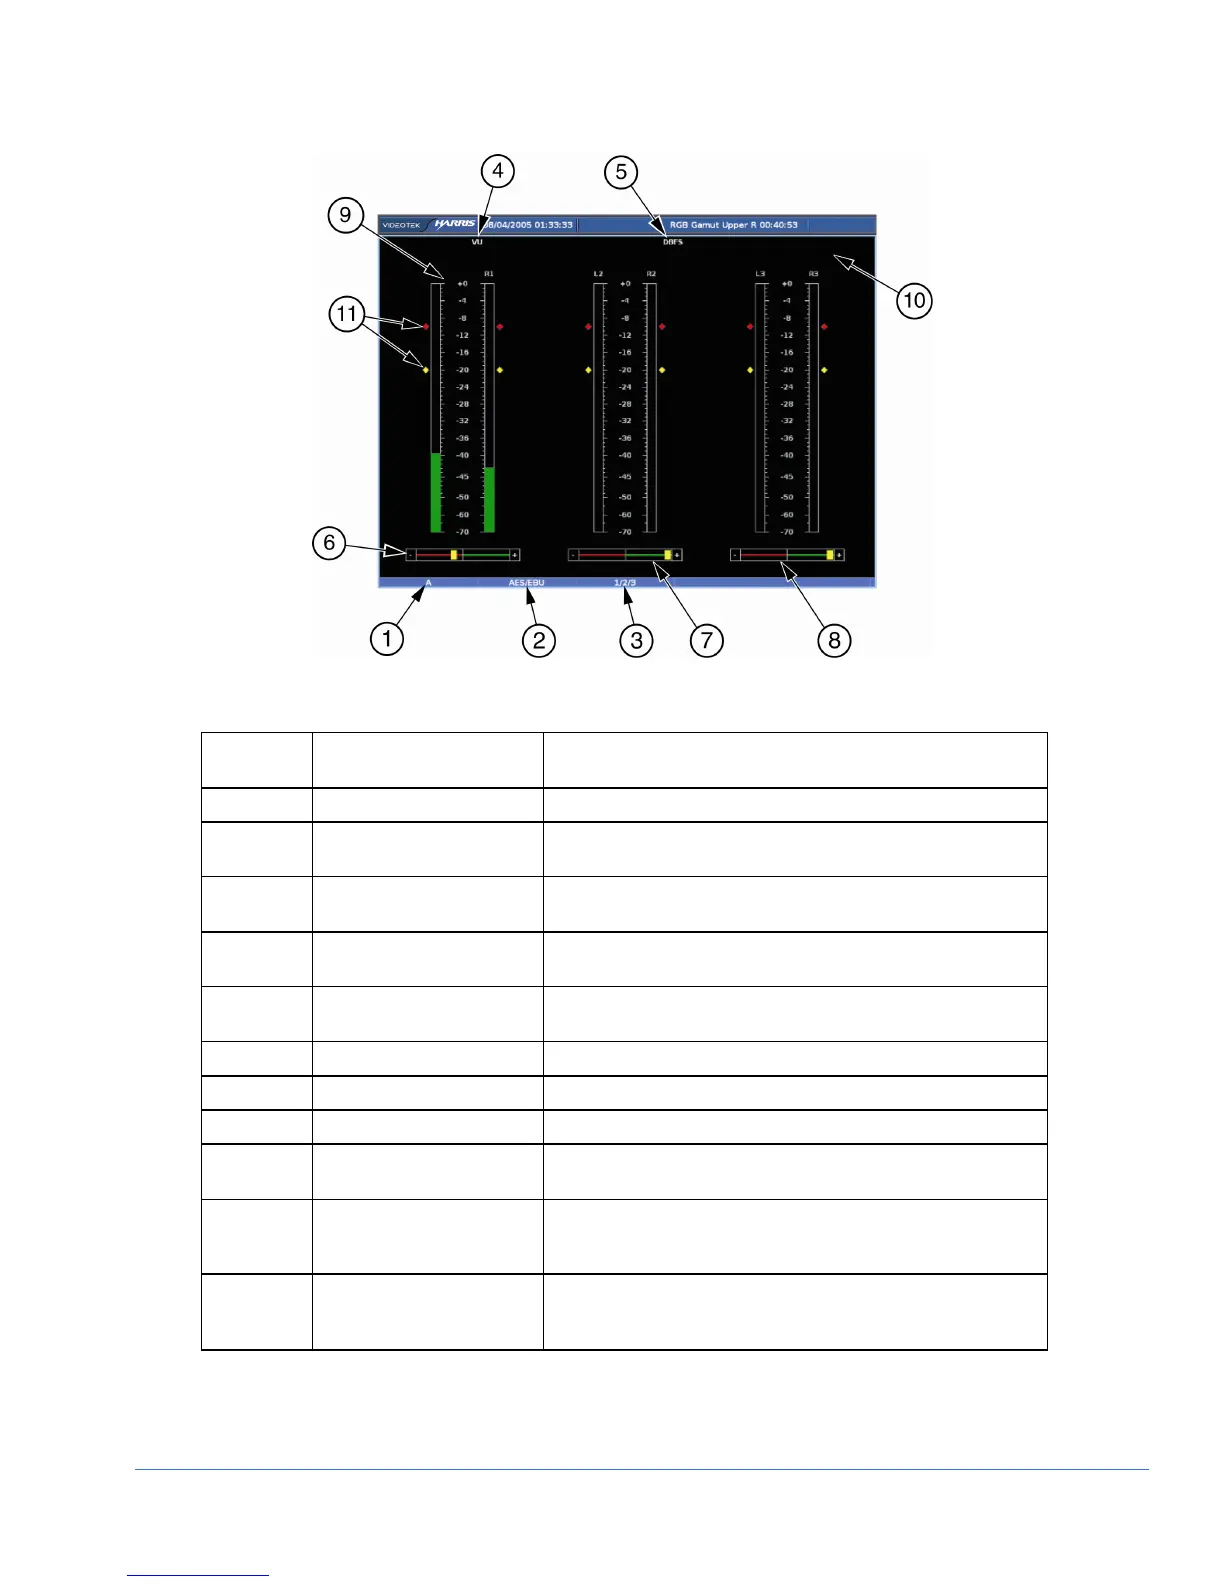
Figure 3-52. Six Bar Graph Diagram
Table 3-42. Description of Six Bar Graph Diagram
Field
Identifier
Field Information Nomenclature
1 Input Displays user-configurable source IDs for input and routers
2 Audio Type Displayed as Analog, AES, Embedded, Dolby AES, Dolby
Embedded
3 Audio Input Displayed information is option dependent; shown as 1-16
(analog is 1-8, AES is 1-16 or 1-8, and Embedded is 1-16)
4 Meter Response Displays the selected meter response: VU, Peak, True
Peak, VU + Peak, VU + True Peak, Custom, Loudness
5 Scale Selection Displays the selected meter scale: Type I, Type IIa, Type
IIb, Type I + 8, Nordic, DIN 45406, dBFS, Zero REF dBFS
6 Phase Bar (1) Phase Meter of bar graph 1
7 Phase Bar (2) Phase Meter of bar graph 2
8 Phase Bar (3) Phase Meter of bar graph 3
9 Audio Graticule (with
meter labels)
Shown as L1, R1, L2, R2, L3, and R3 (or Custom label)
10 Zoom
• Zoom (when enabled)
• Blank when disabled
• Press the ZOOM button to cycle through Zoom modes
11 Level Markers Shows peak and reference levels for the signal; this can be
adjusted in the AUDIO SETUP > METER SETUP > REF
DIGITAL (or ANALOG) menu