6-25
IM AQ6370D-01EN
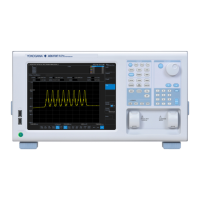
Waveform Display
6
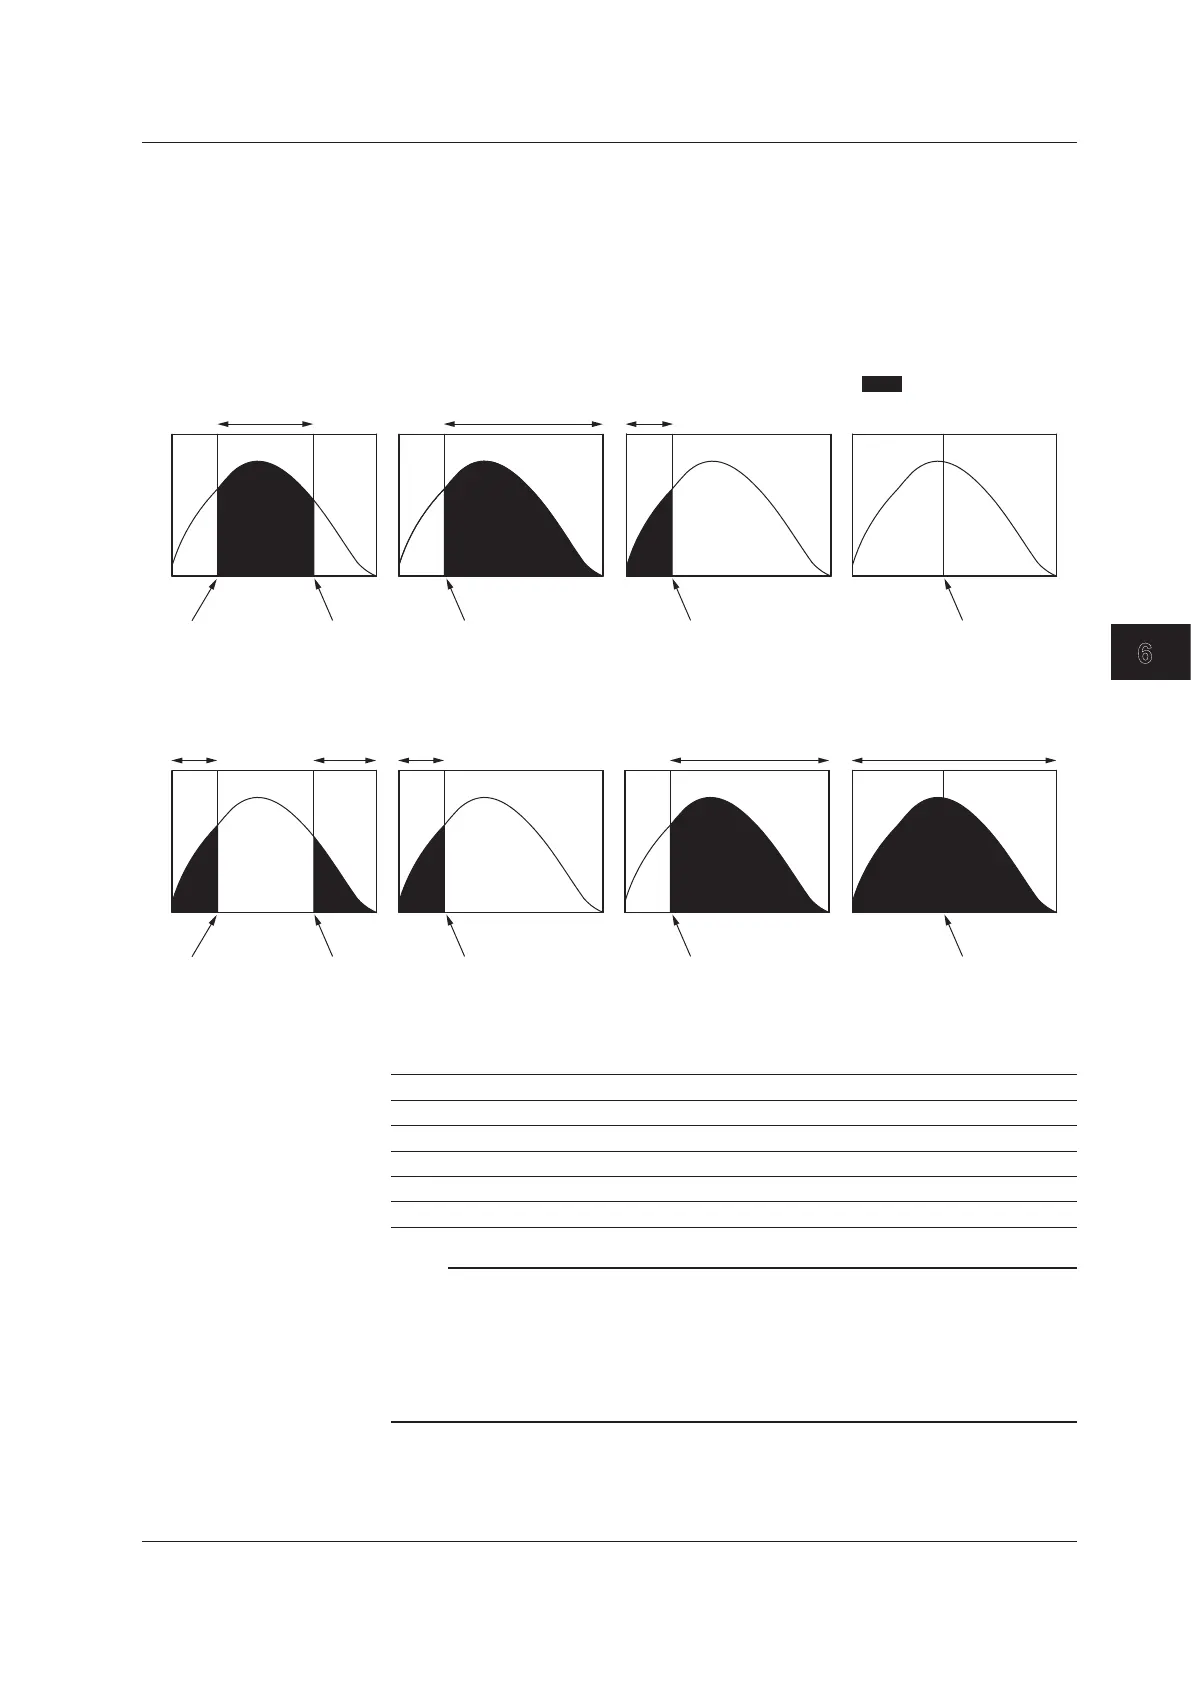
Range of Target Data for Calculation
Vertical axis Data from threshold value to peak.
The threshold value is set in the range of 0 to 99 dB (steps of 1).
Horizontal axis Soft key display.
ALL Targets all trace data for calculation.
INSIDE L1-L2 Targets the data of between line markers for calculation.
OUTSIDE L1-L2 Targets the data outside line markers for calculation.
Line Marker 1 Line Marker 2
Line Marker 1 = Line Marker2
Line Marker 1
or
Line Marker 2
Line Marker 2
or
Line Marker 1
Line Marker 1 Line Marker 2
Line Marker 1 = Line Marker2
Line Marker 1
or
Line Marker 2
Line Marker 2
or
OPERATION AREA when set to OUTSIDE L1-L2
OPERATION AREA when set to INSIDE L1-L2
: OPERATION AREA
Curve Fitting Algorithm
Soft Key Display Description
GAUSS Normal distribution curve
LORENZ Lorenz curve
3RDPOLY 3rd poly
4THPOLY 4th poly
5THPOLY 5th poly
Note
If G=MKR FIT is selected, fitting cannot be performed if only a small number of markers are
placed. A warning displays in these cases: WARNING 111: <G=MKR FIT>failed
GAUSS, LORENZ: Fewer than 3 markers
3RD POLY: Fewer than 4 markers
4TH POLY: Fewer than 5 markers
5TH POLY: Fewer than 6 markers
6.7 Curve Fitting
 Loading...