7-60
IM AQ6370D-01EN
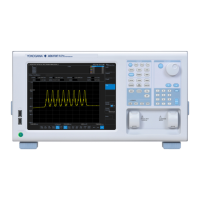
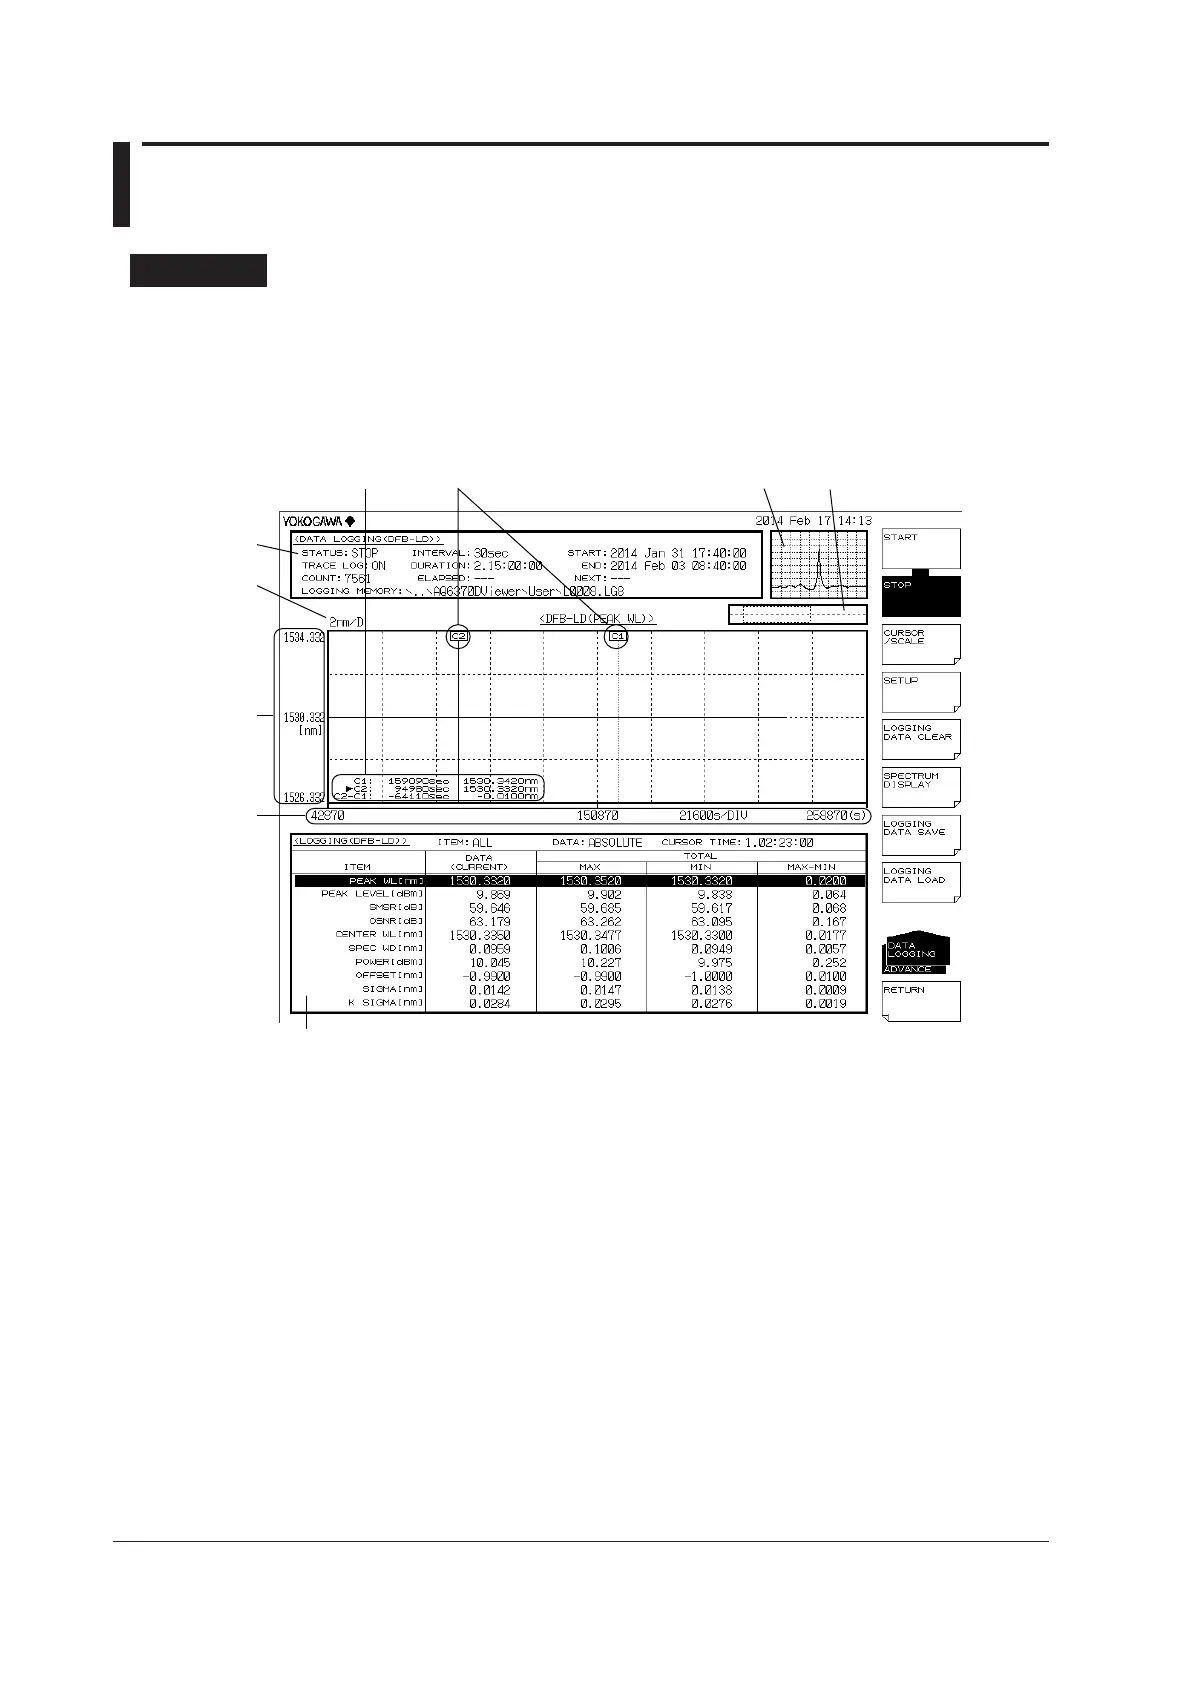
7.15 Analysis Data Logging
Procedure
The analysis data logging function measures and records WDM analysis, DFB-LD
analysis, and peak data at regular intervals and displays the data in tables and graphs on
the screen. The contents in the table and the optical spectrum data of each measurement
can be saved to files.
Logging Screen
Number Function
1 Parameter display area
2 Wavelength scale (per division)
3 Displays different scales depending on the displayed item, such as
wavelength, power, and SNR.
4 Time scale
5 Cursor information (C1, C2, C2-C1)
6 Cursors (C1, C2)
7 Thumbnail area. Displays the waveform data at the current cursor position.
8 Overview display. The current graph area is indicated with a dotted frame.
9 Logging data list
 Loading...