115
Running a Gradient Analysis
Observing the Chromatogram
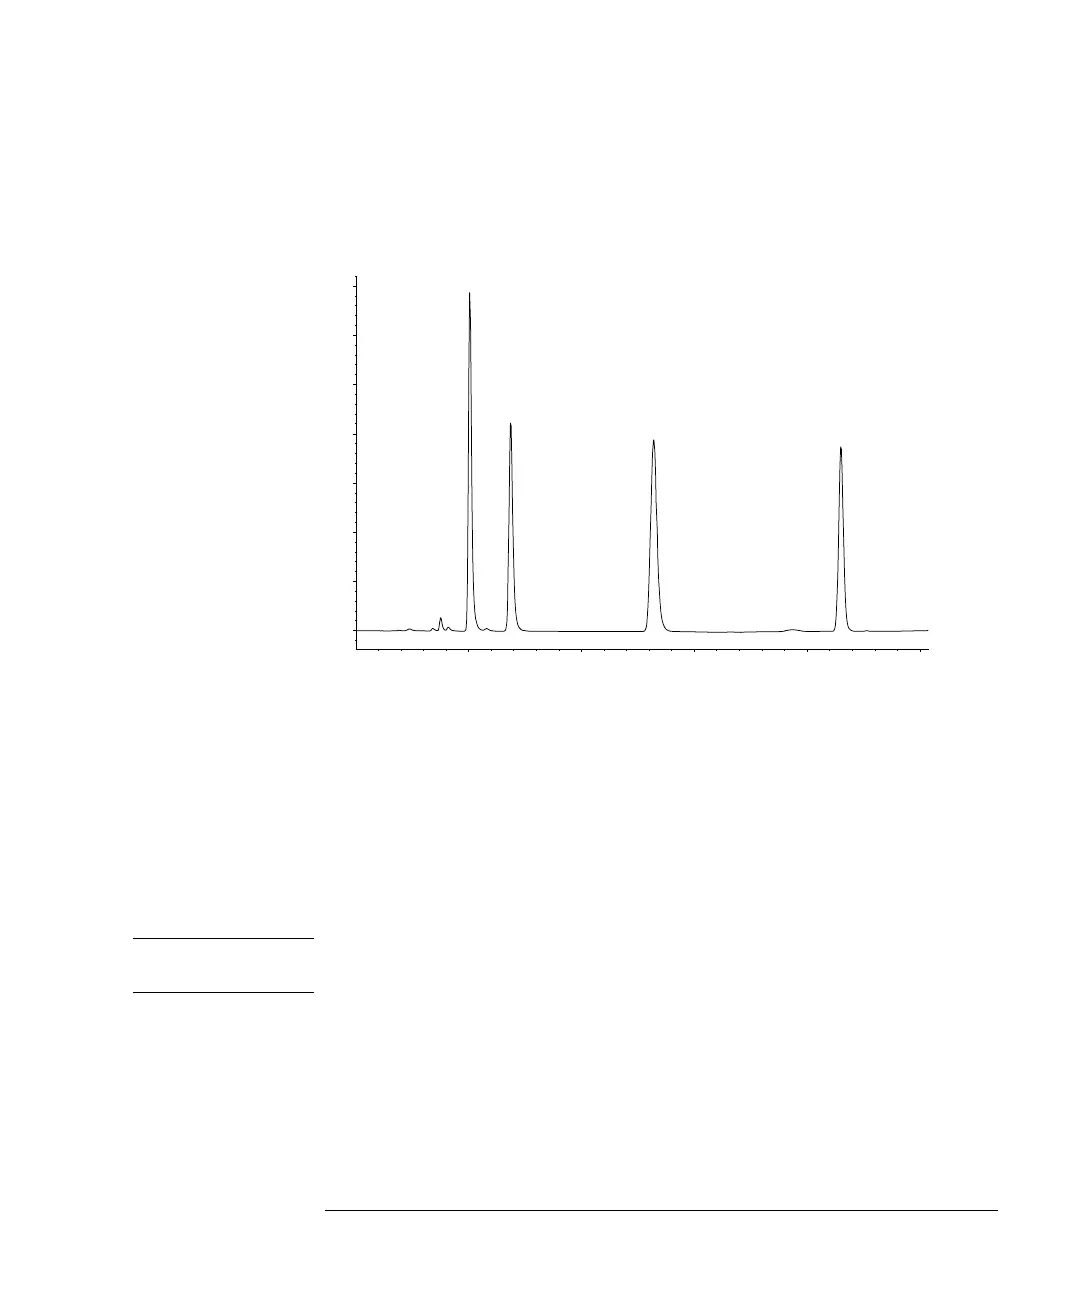
A typical gradient chromatogram for this analysis is shown in Figure 17.
Figure 17 Gradient Analysis of Isocratic Standard
The exact profile of the chromatogram will depend on the column you have used.
Differences in retention times and areas of the peaks in your chromatogram and the
one shown in Figure 17 might be a result of variations in the concentration of the
sample from batch to batch, the quality of the solvents used and the column
temperature.
If you compare this chromatogram with the one from Chapter 9 “Running an
Isocratic Analysis” you will notice the solvent gradient has reduced the elution time
of the fourth peak in the chromatogram.
NOTE You can rescale the plot using the Rescale button [F7], or the cursor keys or you
define the plot window within the Setup.
min
1234
mAU
0
50
100
150
200
250
300
350
 Loading...