30
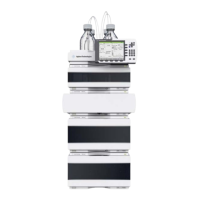
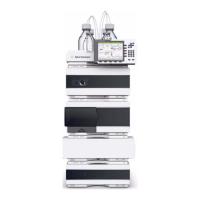
The Agilent 1100 Series Control Module
Control Module Software
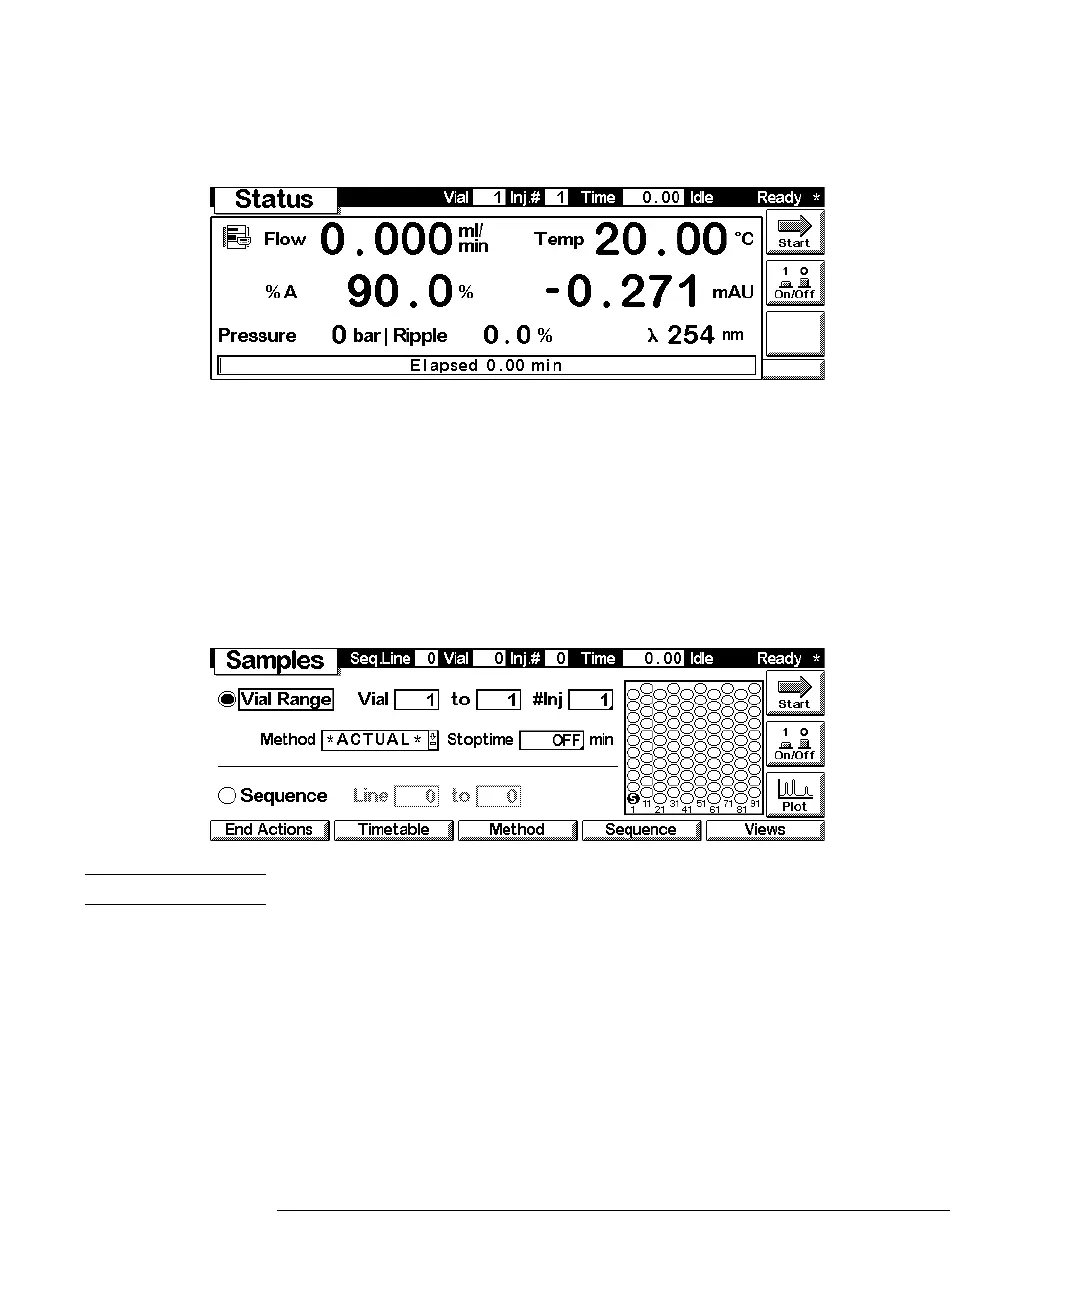
Figure 10 Status Screen
Samples Screen
Operating from this screen you have easy access on the sample tray. Using the Vial
Range function you can specify the vials you want to analyze and the desired
method. A graphical image of the tray offers a good view of the vials chosen. The
Sequence option gives you control over the execution of specified analysis sequence
steps programmed before. While the analysis is running you can view the processed
samples on the tray image.
Figure 11 Samples Screen
NOTE This screen is only available if an autosampler is part of your system.
Plot Screen
The Plot screen provides an online plot. You can view various signals, depending on
the modules in the system, e.g. a chromatogram, pressure signal or temperature
signal.
Directly from the Plot screen you can use a cursor to pinpoint information and you
can observe information like run time, status, pressure ripple or composition.
 Loading...