The PACT Application Applications
Agilent 8163A Lightwave Multimeter, Agilent 8164A Lightwave Measurement System, & Agilent 8166A Lightwave
Multichannel System, Fourth Edition
189
If the step size is very large in comparison to the sweep range, a box requesting
you to correct the [λ Stop], [λ Start], and [Step] may appear.
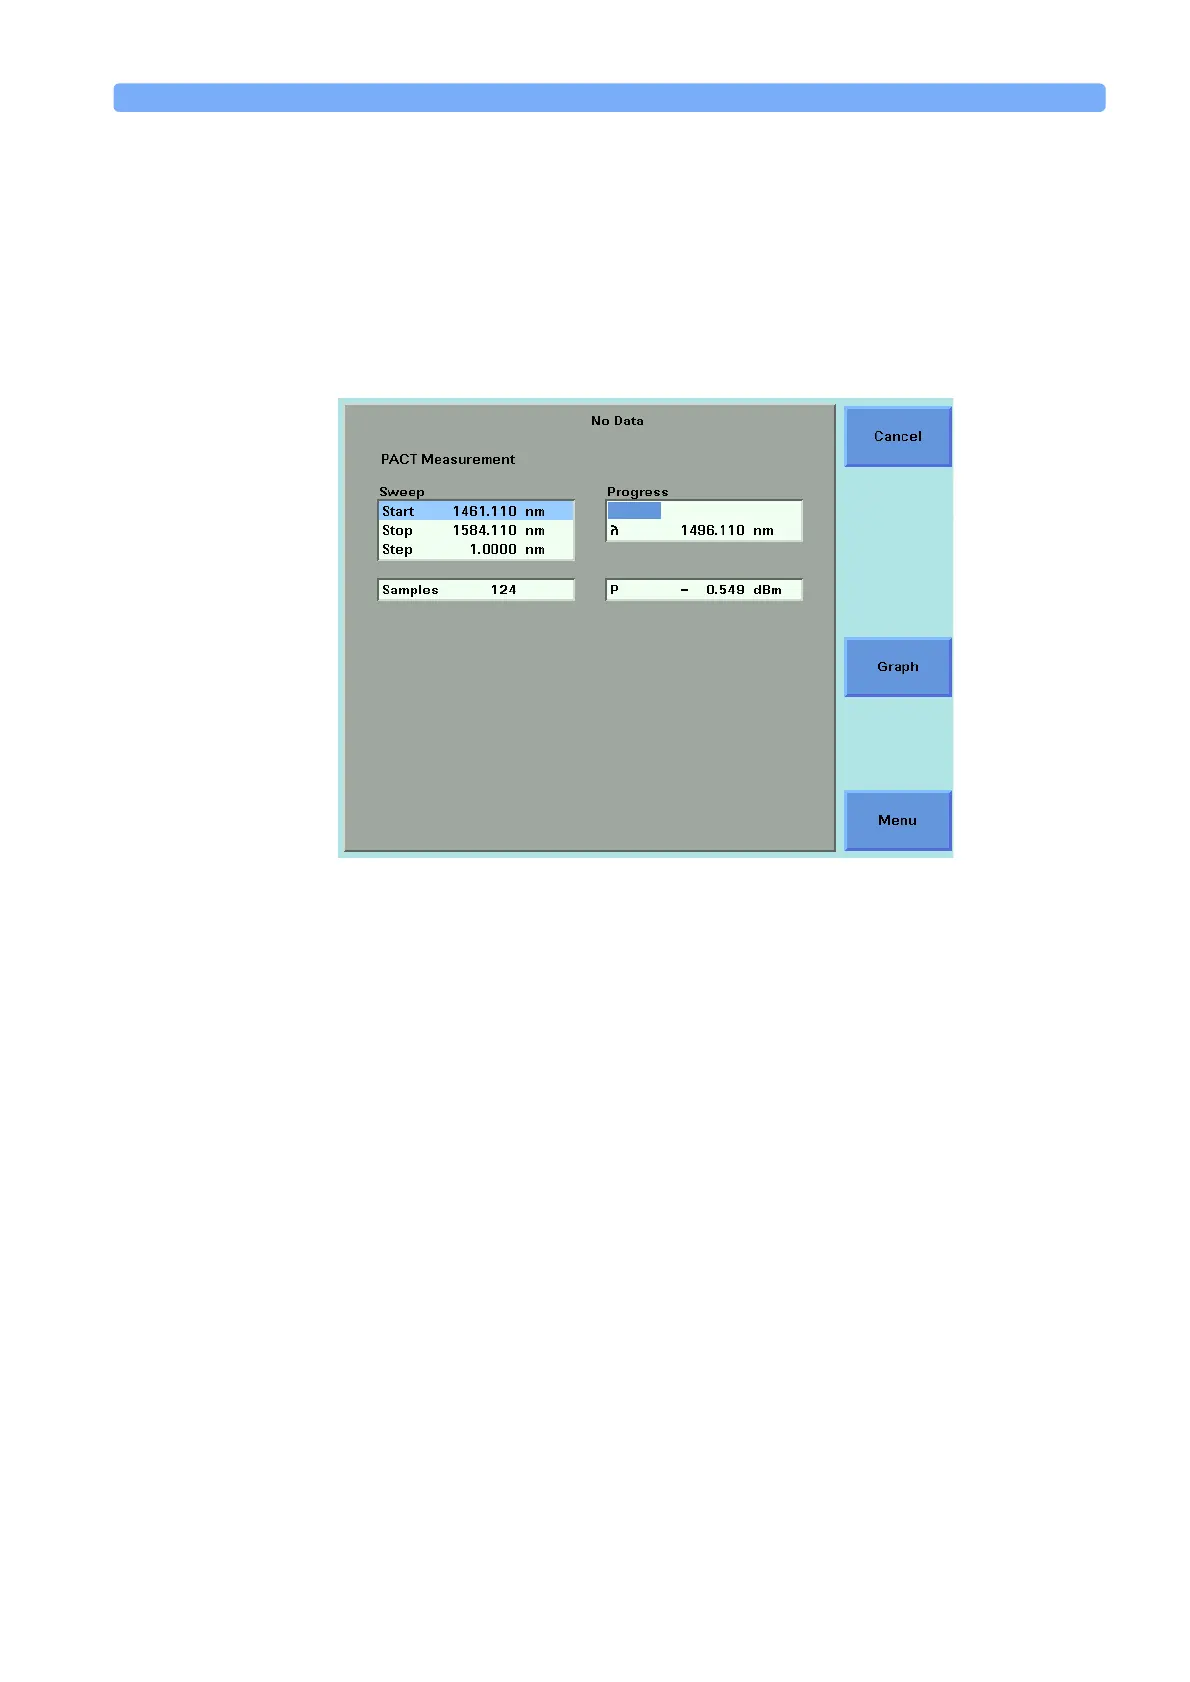
The PACT Measurement Screen, as shown in Figure 139, appears. The
number of samples that each Power Meter will record and the output laser
power are displayed. If <Continuous> was selected as the sweep [Method], the
sweep speed, [VSweep], is displayed.
NOTE The application chooses the power, [P], see step 15 for more information.
26 There are two softkeys available from the PACT Measurement screen.
– Press [Graph] to view a graph of the Measurement results as the results are
measured. Press [Close] to return to the PACT Reference Measurement
screen. See “Working with Application Graphs” on page 155 for
information on zooming in and out.
– Press [Cancel] to return to the PACT Reference screen without completing
the stability application.
NOTE If you choose <High> or <Medium> as the [Dynamic] parameter and
<Continuous> sweep mode, the graph will update at the end of each sweep.
Figure 140 shows a graph with low dynamic range that is the result of a single
Figure 139 PACT Measurement Screen
 Loading...


