SA (Spectrum Analyzer) Mode 103
o Negative Peak [NPk] Displays the minimum value of all the measurements
in each bucket.
o Sample [Smp] Displays the center measurement of all the measurements in
each bucket. This setting gives a good representation of the random noise in
each bucket. However, it does not ensure that all signals are represented.
o Average [#RMS] Displays the Root Mean Squared (RMS) average power of
all the measurements in each bucket. This is the preferred method when
making power measurements. Learn more on page 157.
Display Line
A display line is a simple, horizontal line that can be placed at any amplitude
level on the SA screen. Use a display line as mental guide for visual feedback. A
display line is similar to a Limit Line, except that no PASS/FAIL testing occurs.
A display line is easier to create than a Limit Line. Learn about Limit Lines on
page 158.
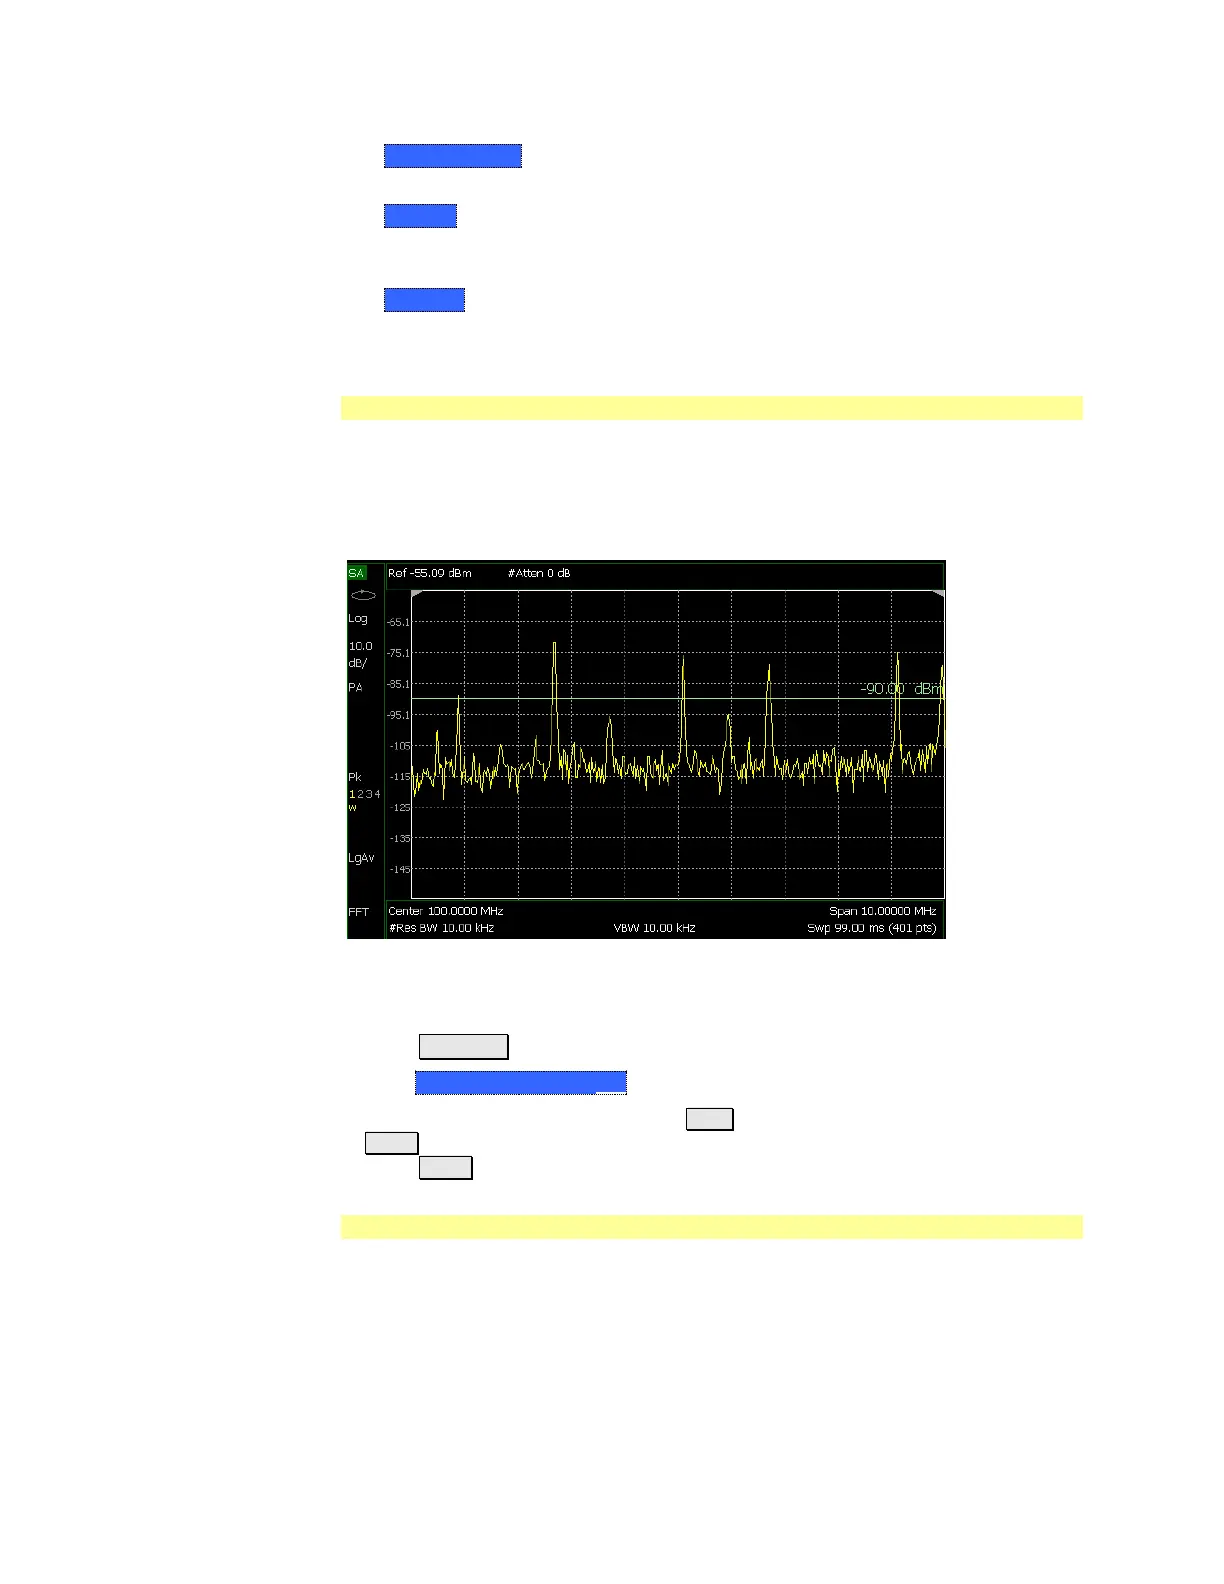
Display line with annotation
How to create and move a Display Line
Press Limit __8
Then Display Line OFF ON
Then enter a Y-axis value using the ▲|▼ arrows or the rotary knob, then press
Enter. Or enter a value using the numeric keypad and press a suffix key or
press Enter.
Noise Marker
For comparison purposes, electronic noise measurements are often displayed as
though the measurement was made in a 1 Hz Res BW. However, making an actual
measurement at a 1 Hz Res BW is impossible, and at 10 Hz, extremely slow.
A Noise Marker, unique to SA Mode, mathematically calculates the noise
measurement as though it were made using a 1 Hz bandwidth.
 Loading...