17-34
PPC Manual Revision 1
Chapter 17: Software Setting Flow and Navigation
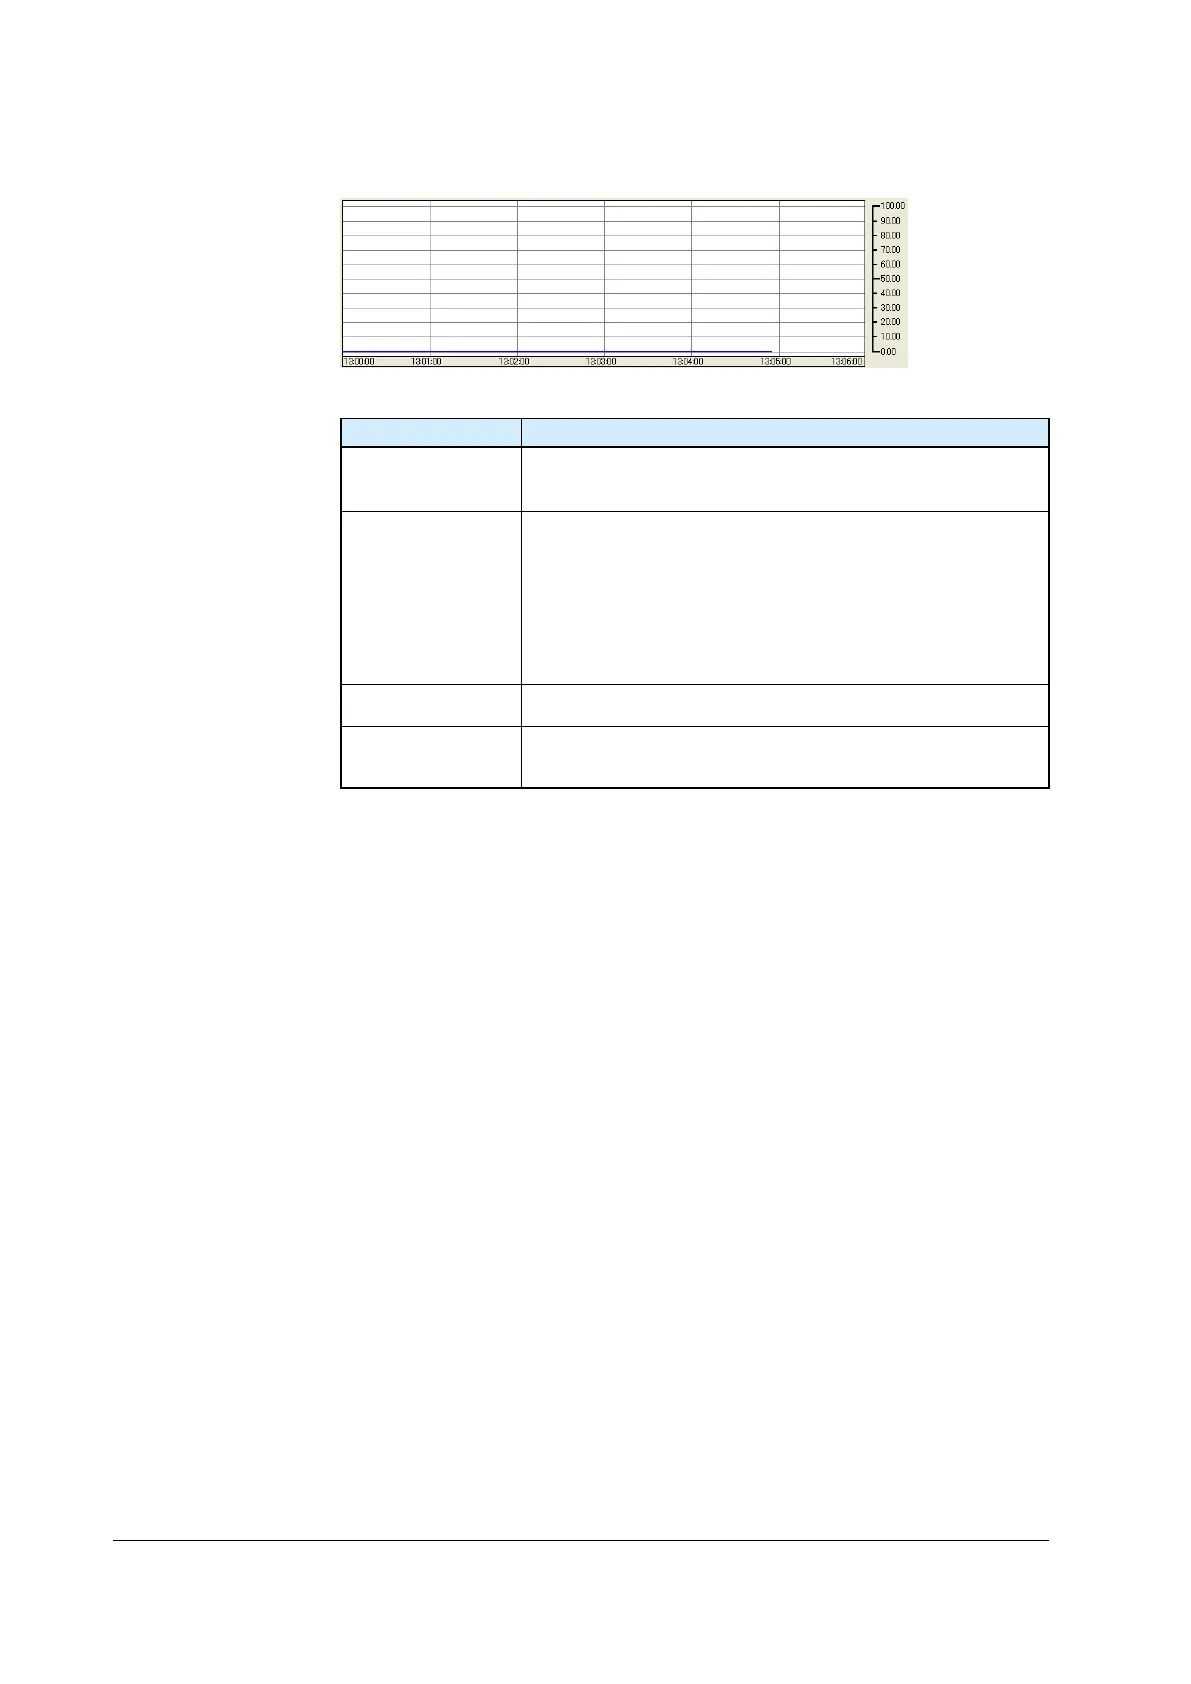
(2) Trend display area
Display Description
Scale display
Maximum value to minimum value of the input range (Loop 1 and Loop
2)
Scale divisions: 11
Trend
Trend data of -5.0 to 105.0% (0 to 100% scale) is displayed.
Display update period: Data read cycle
Plotting: Plotting from the left
When the trend is plotted up to the right end, the display area is
scrolled to the left by 2/3 hours on the time-axis scale.
If a value exceeds the range, trend display is limited. However, read
data is saved as is in a .csv file. Trend data is displayed starting on the
left end.
X-axis (time-axis) scale
The time axis is automatically calculated according to the data read
cycle.
Background color
Right-clicking on the trend graph and selecting Background Color
from the shortcut menu which appears causes the Color dialog box to
appear, enabling you to change the trend display color.

 Loading...