17-36
PPC Manual Revision 1
Chapter 17: Software Setting Flow and Navigation
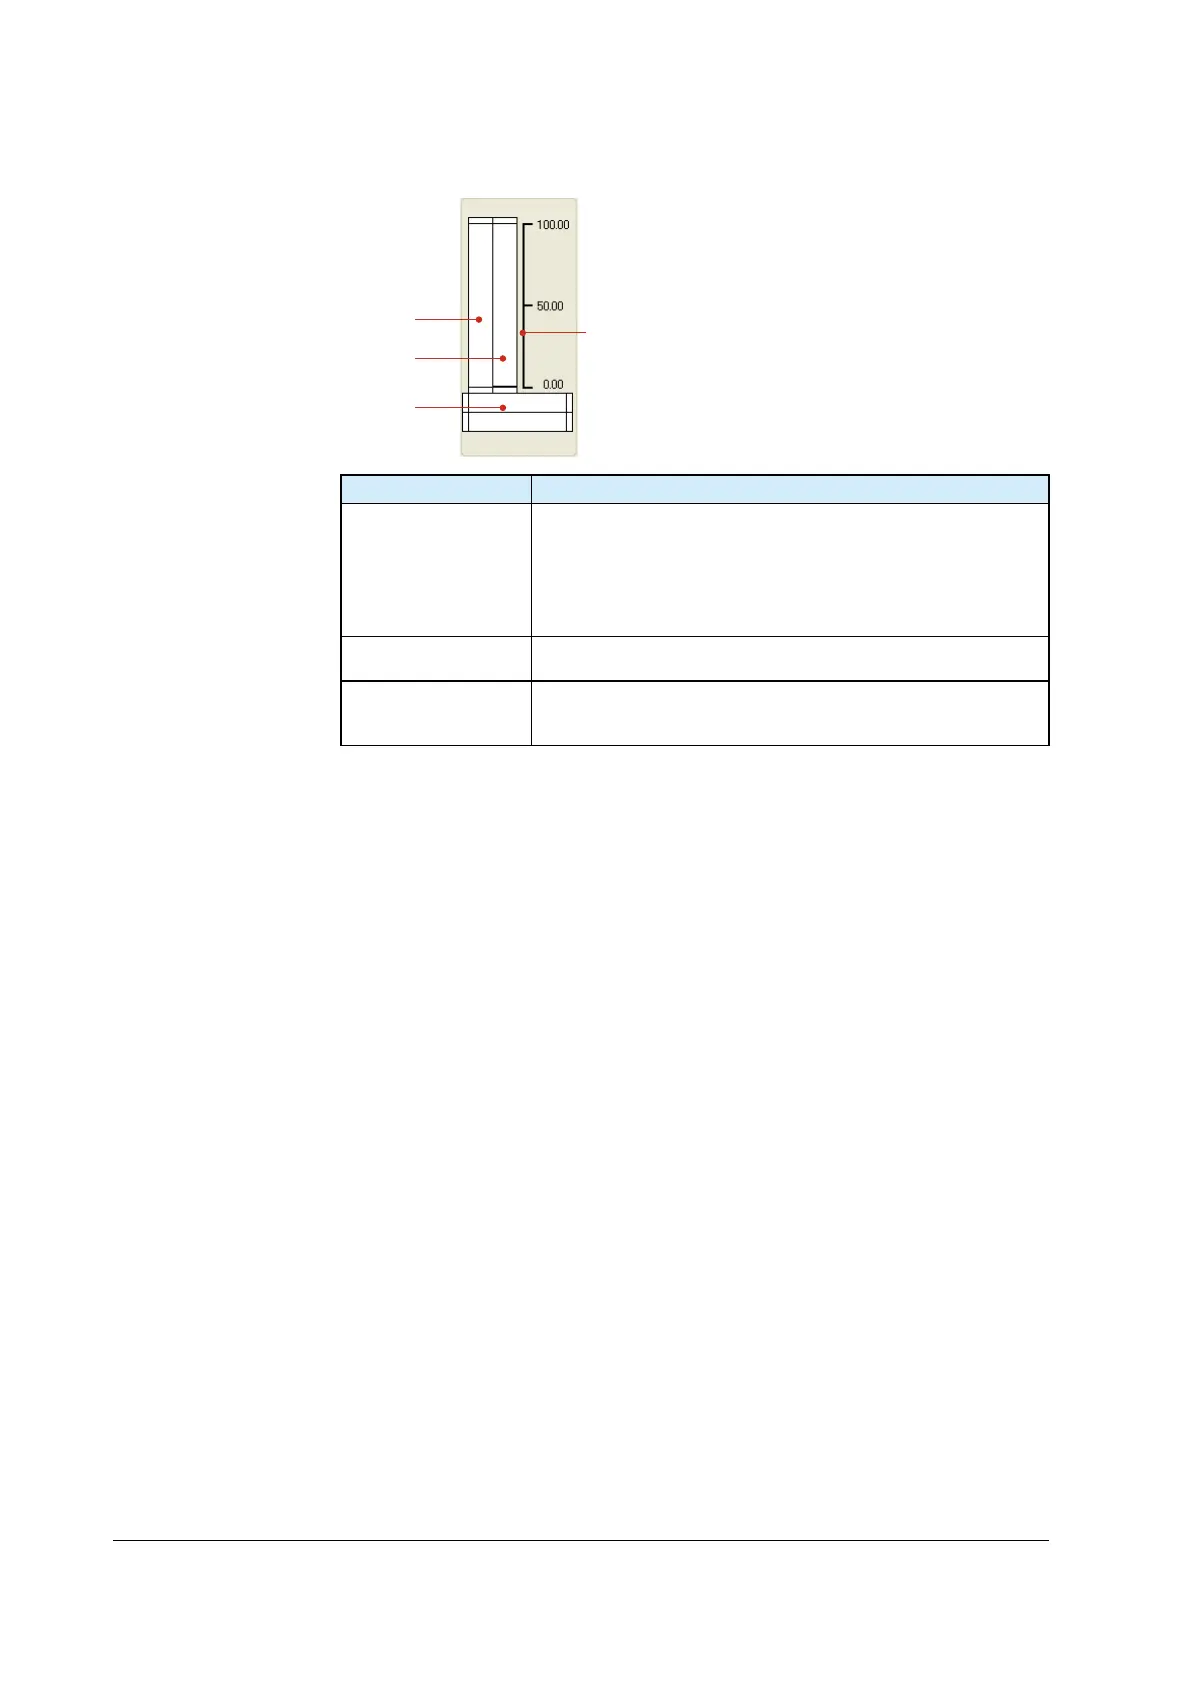
(4) Bar graph display area
SP bar
Scale
PV bar
OUT bar
Display Description
SP and PV bars
Display the SP and PV values of the loop selected by LOOP switching
in a bar graph.
LOOP1
SP bar: green, PV bar: blue
LOOP2
SP bar: pink, PV bar: orange
OUT bar
Displays OUT values in a bar graph.
Control output: purple
Scale
The maximum value to minimum value of the input scale (Loop 1 and
Loop 2)
Memory: 3 points
The display update period is the data read cycle. Data to be updated are SP bar, PV bar, and
OUT bar.
 Loading...