ST100A Series Flow Meter OPERATION
Fluid Components International LLC 39
ST100A Series Configuration Software
The ST100A Series comes with a configurator utility (Windows) that provides comprehensive programming of the instrument’s settings via
a PC connection to the instrument’s USB or Ethernet service port (refer to Service Port Connection, USB & Ethernet, page 33). Configure
the ST100A Series to your application using the ST100A Series configuration software. Refer to the ST100A Series Configuration Software
manual 06EN003481 for full instructions on the use of the application. Refer also to ST100A Series Configuration Software Application
(User Password: 2772) below for further details.
Make sure the ST100A Series is up and running
connecting to USB or launching the configurator application.
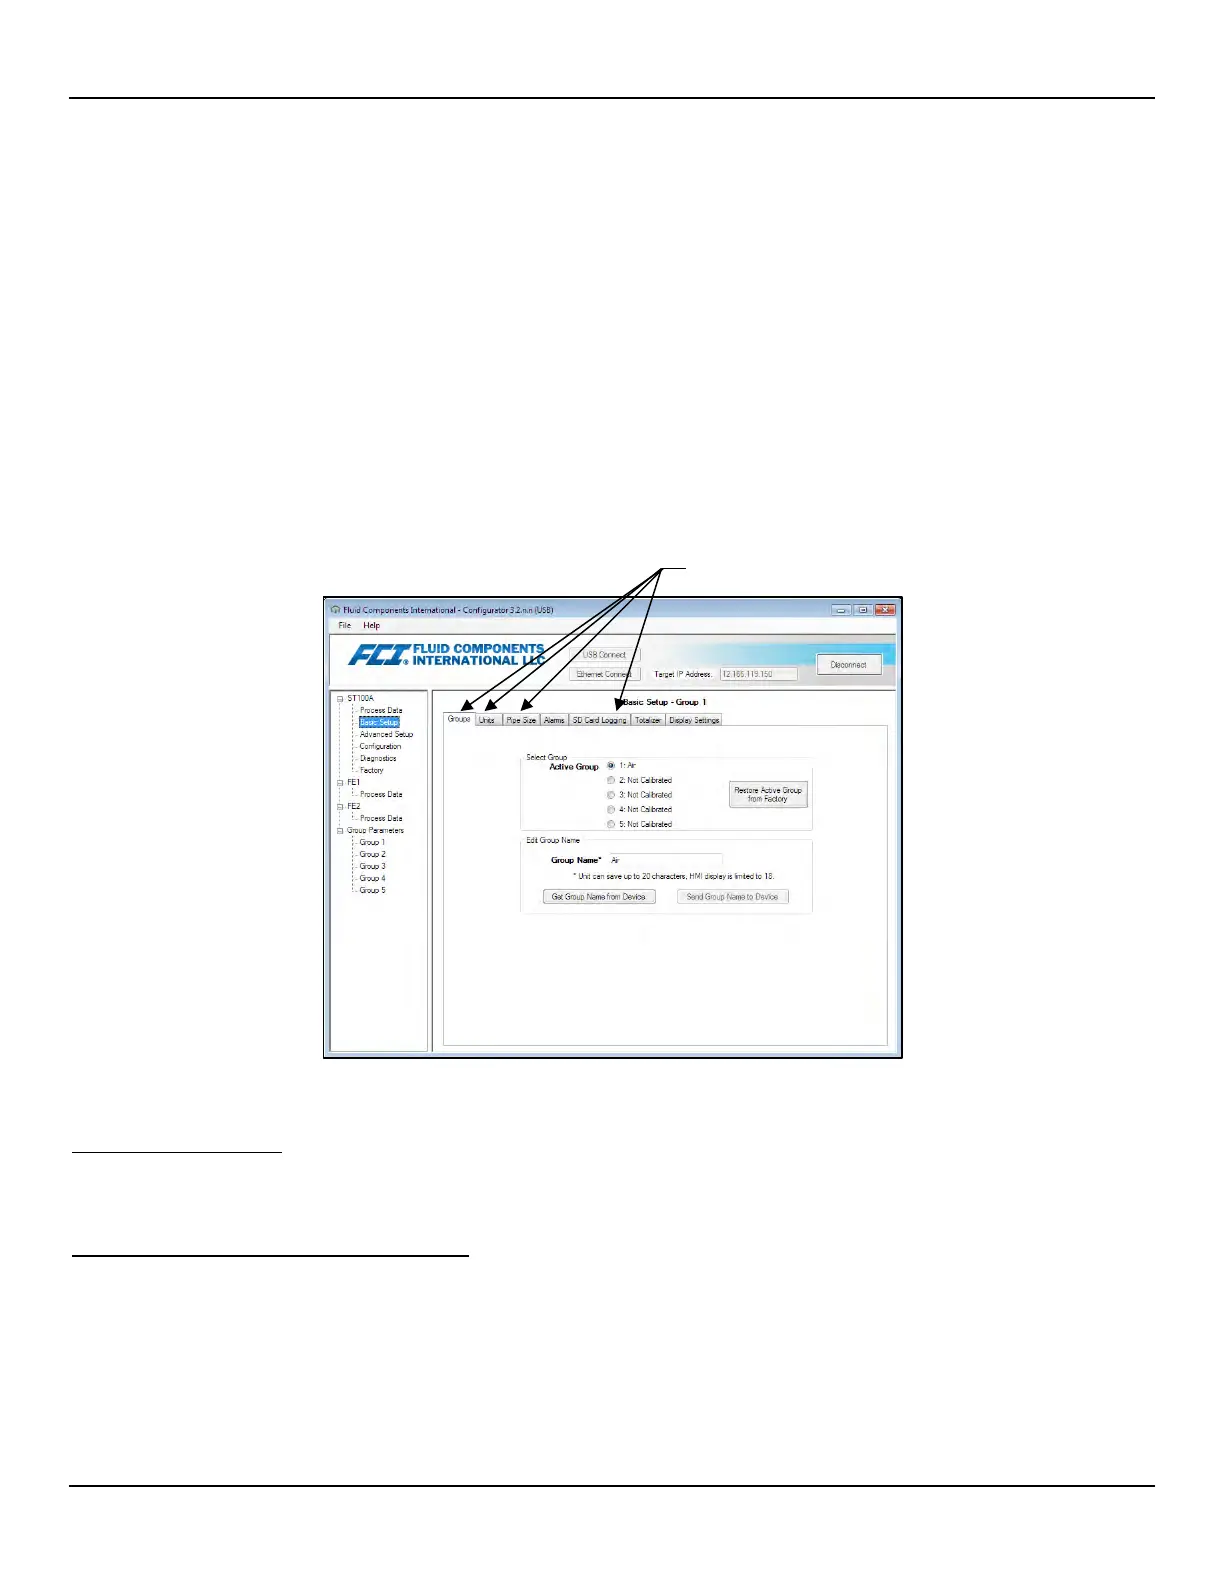
Basic Setup Options, Configuration Software
The setup parameters accessed by the optional HMI are also accessible via the configuration software’s Basic Setup menu. See Figure
37 below. For units without an HMI display use the configuration software to perform basic instrument setup. The Basic Setup menu tabs
to use are: Groups, Units, Pipe Size, and Display Settings. If needed, use the Alarms and Totalizer tabs to complete the instrument
configuration. Refer to Basic Setup Options, HMI on page 37 for an overview of the setup parameters. Refer also to the ST100A Series
Configuration Software manual 06EN003481 for detailed information about the software.
Figure 37 – Configuration Software Tabs for Basic Setup Functions
Verify Engineering Units
Verify that the engineering units are correct for flow rate, temperature (and pressure is equipped). Use the HMI menu or configuration
software to make any necessary changes.
System Faults, Alarms and Logging Indication
The ST100A Series optional display shows system faults, alarms, and data logging activity by displaying three different icons when these
conditions are present. As shown in Figure 38 below, these icons appear directly above the flow rate indication on the main process data
screen. FAULTS are displayed as a caution triangle icon, ALARMS as a bell icon, and LOGGING as a sheet of paper (on which LOG is
printed) icon.
Use these tabs for basic setup programming.
 Loading...