132 133
IIDTool
GAP Diagnostic 2019-07-15 All Rights Reserved
User Manual : Version 33, Firmware V3.0
4.8.3 App Viewing live values when using the mobile App
Live value selection and sampling rate
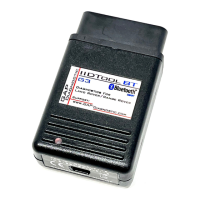
You can select up to 8 live values in the graph and numeric display modes. All 8 values can be viewed
simultaneously. The maximum sampling rate of each live value is divided by the number of live values
selected. For example, if one live value is selected, the maximum sampling rate will be 16 per second
/1livevalues=16samplespersecond.Iffourvaluesareselected,16/4=4samplespersecondfor
each live values. The absolute maximum sampling rate of each live value is determined by the ECU.
BT/Pro, All except L322 2002 to 2004. User can choose between tested and untested live values.
Untestedlivevalueswillnotwork(N/A)oneveryvehicleandcongurations.Theymayalsobede-
pendentonthermwareversionoftheECU.
II Untested live values are not avaible.
Basic controls
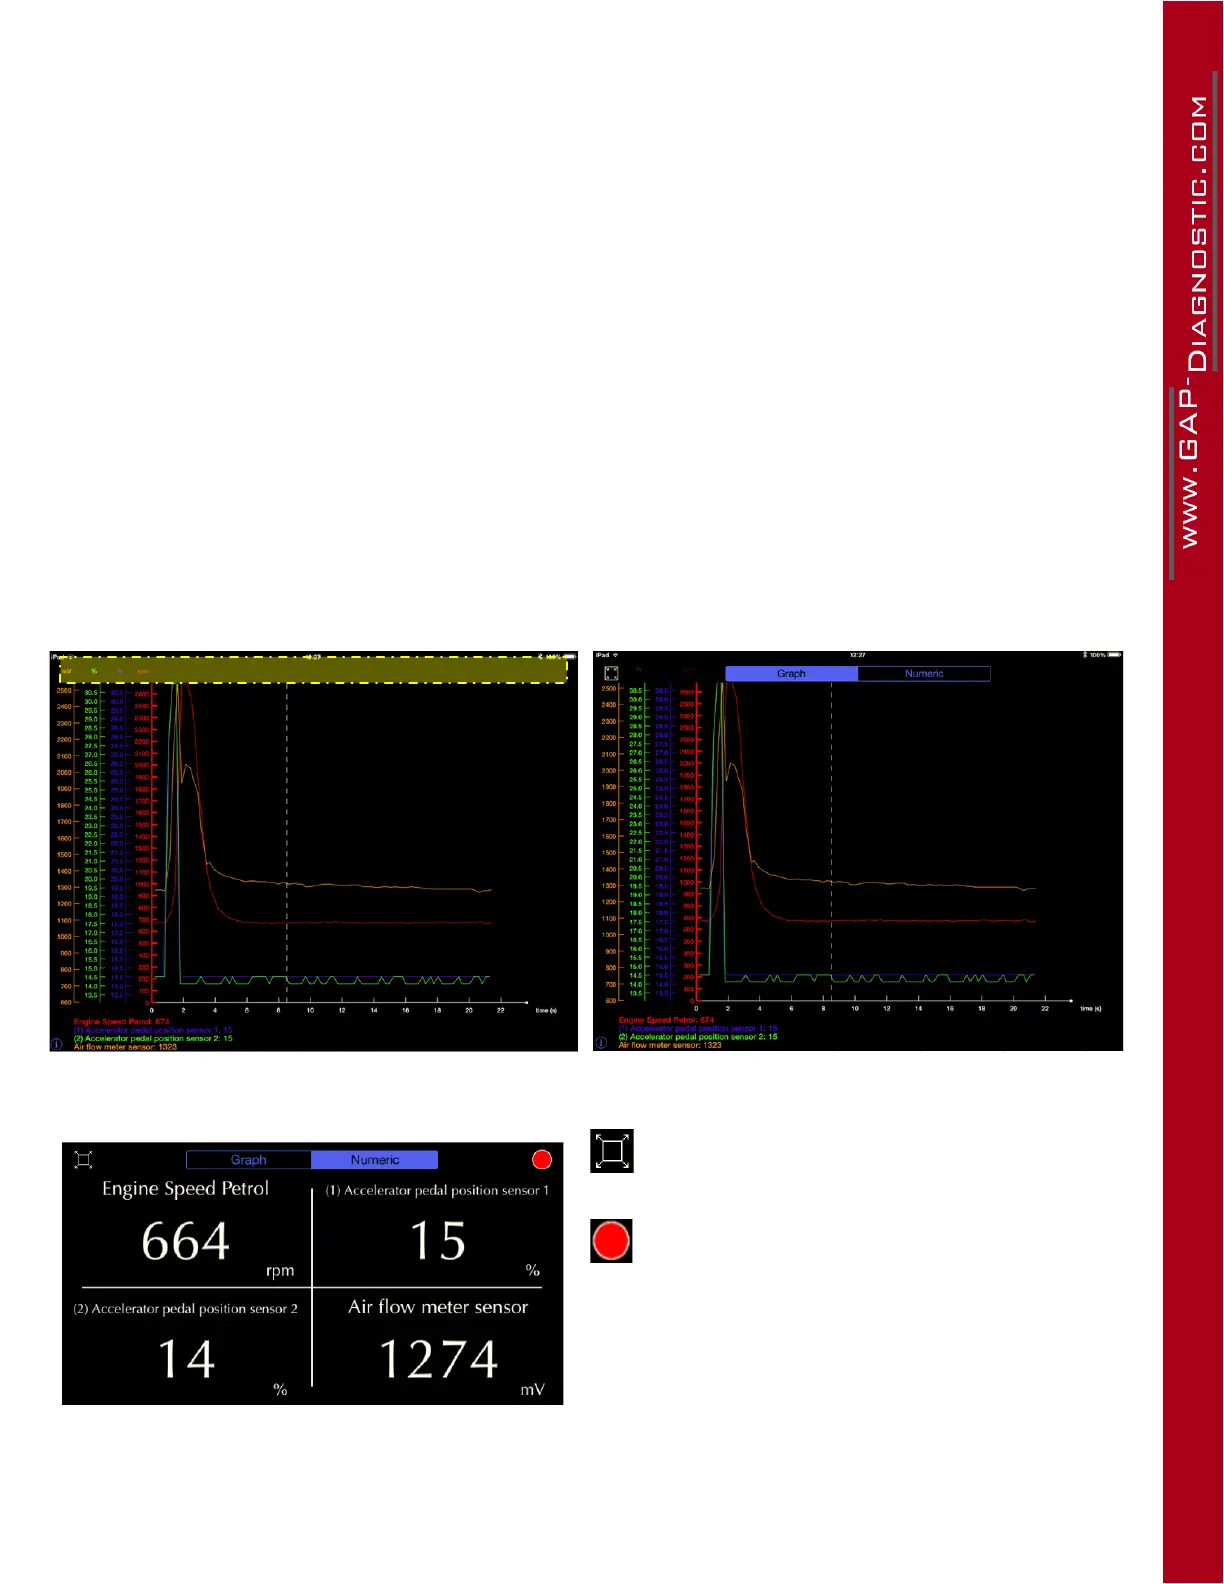
Press in the yellow area to make the top option bar appear.
Figure 60. App : LV : Calling the top bar
Figure 61. App : LV : Top bar options
Fullscreen/splitscreenbutton
This button begins recording data. Once pres-
sed, the stop button (same location) will allow the
user to stop, save and name the recording (log) if
required. Saved logs can be accessed by selec-
ting“Logs”intheLiveValuesorloginscreen(o-
line mode allowed). See section 4.8.4