134 135
IIDTool
GAP Diagnostic 2019-07-15 All Rights Reserved
User Manual : Version 33, Firmware V3.0
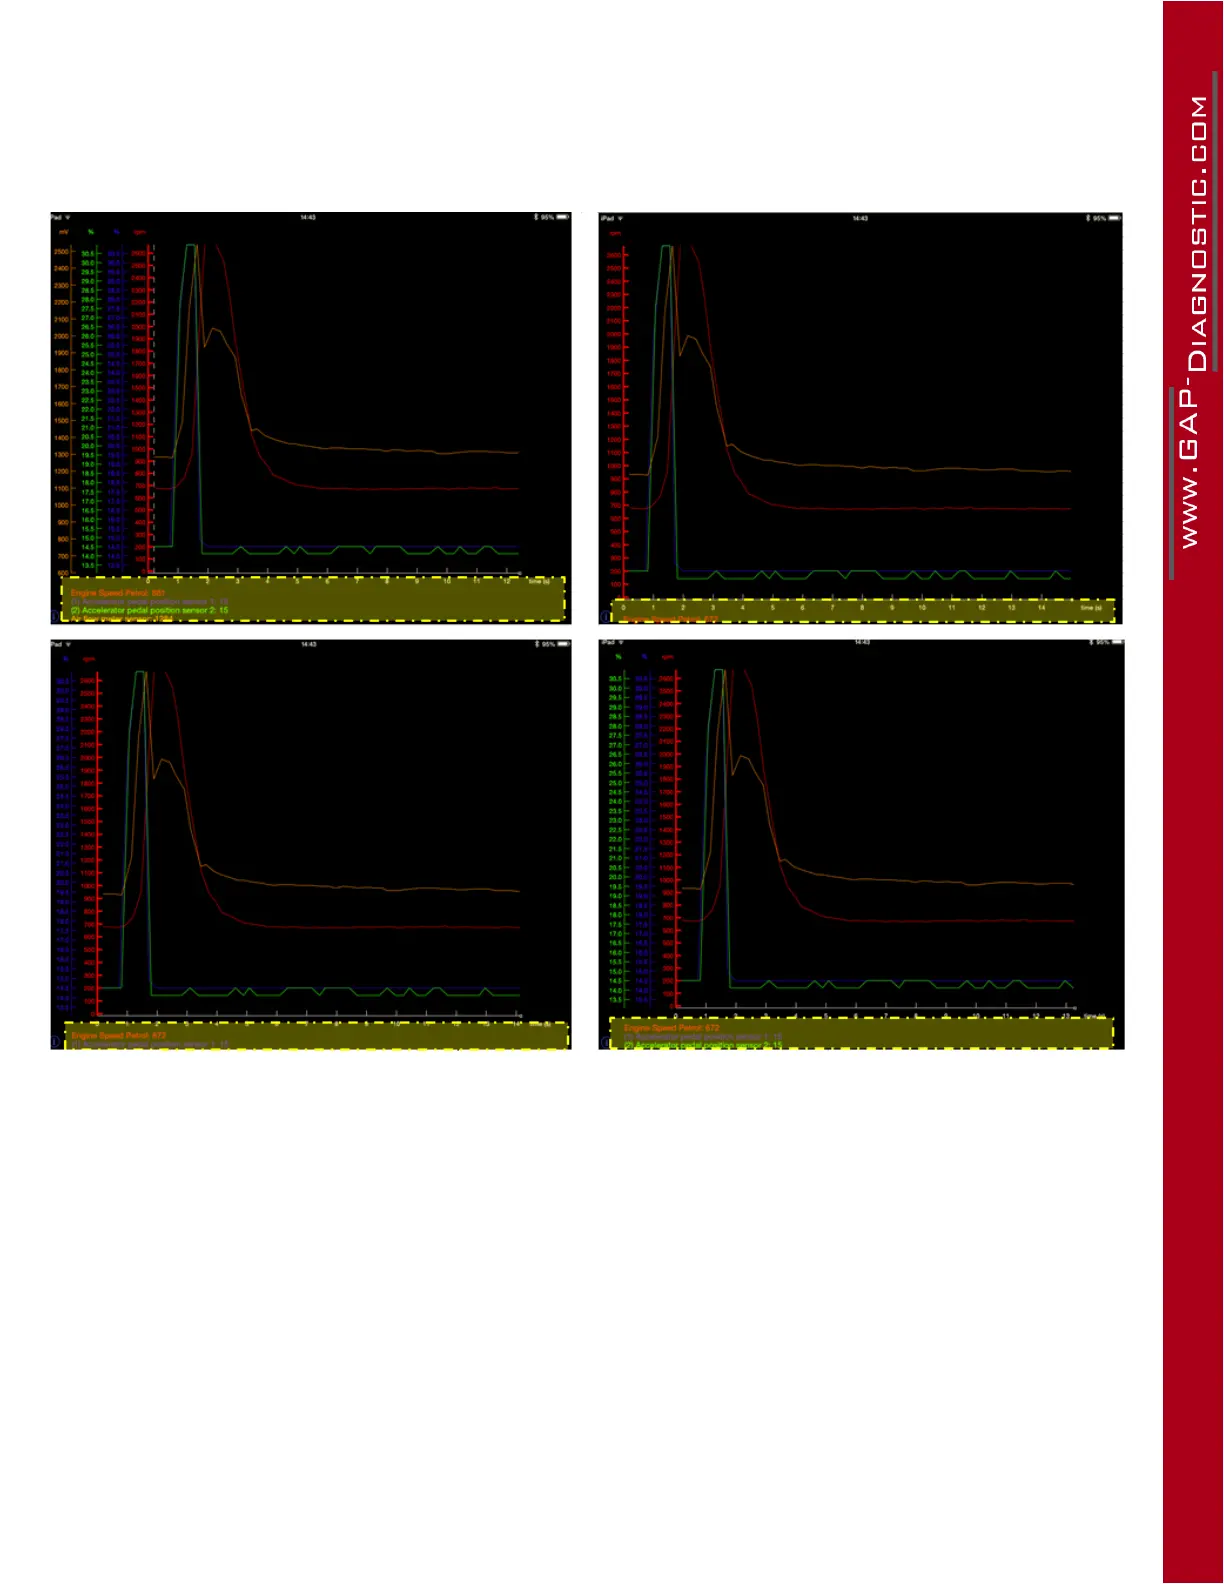
Graph view options
Press in the yellow area to select how many live values Y axis and names are displayed. All the data
will remain visible on the graph. This was implemented to maximize available graph area.
Figure 63. App : LV : Axis displayed