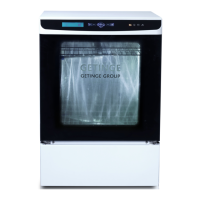
3.2.3.1.7 Printer setup
The print-out can be provided in the form of a report with all the
simultaneously measured values printed in rows, so called logging,
and/or as a graph. Various printing options determine exactly how
the printouts will be designed.
Printing options Description
Option 1 An introduction with batch information
is followed by logging during the
ongoing
process.
Option 2 The printout corresponds to option 1,
but is subsequently supplemented
by the process in the form of one or
several following graphs. The graphs’
appearance, used units or
measurement values can be defined
with
the operator display.
Option 3 An introduction with batch information
is followed by the process in the form
of a
graph. The graph is drawn in real-time
during the ongoing process and
completed at the
same time. Any alarms that were
activated are printed out
after the graph along with all
measurement values at the time of the
alarm.
Disk storage is not possible for option
3.
Option 4 The process, in the form of one or
several graphs, is drawn in parallel to
the
logged measurement values. When
using this option, the log interval
should be set to at
least 30 seconds so that there is
enough time to draw the graph
between loggings.
Disk storage is not possible for option
4.
3 MENU TREE
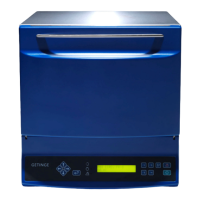
28 (128) TECHNICAL MANUAL GETINGE WD15 CLARO
<Doc_TEC><Doc_6001396902><Rev.I><Lang_en>