To get more detailed information about the status of a specific access point, users can click on the desired
AP then a page similar to the following will show up:
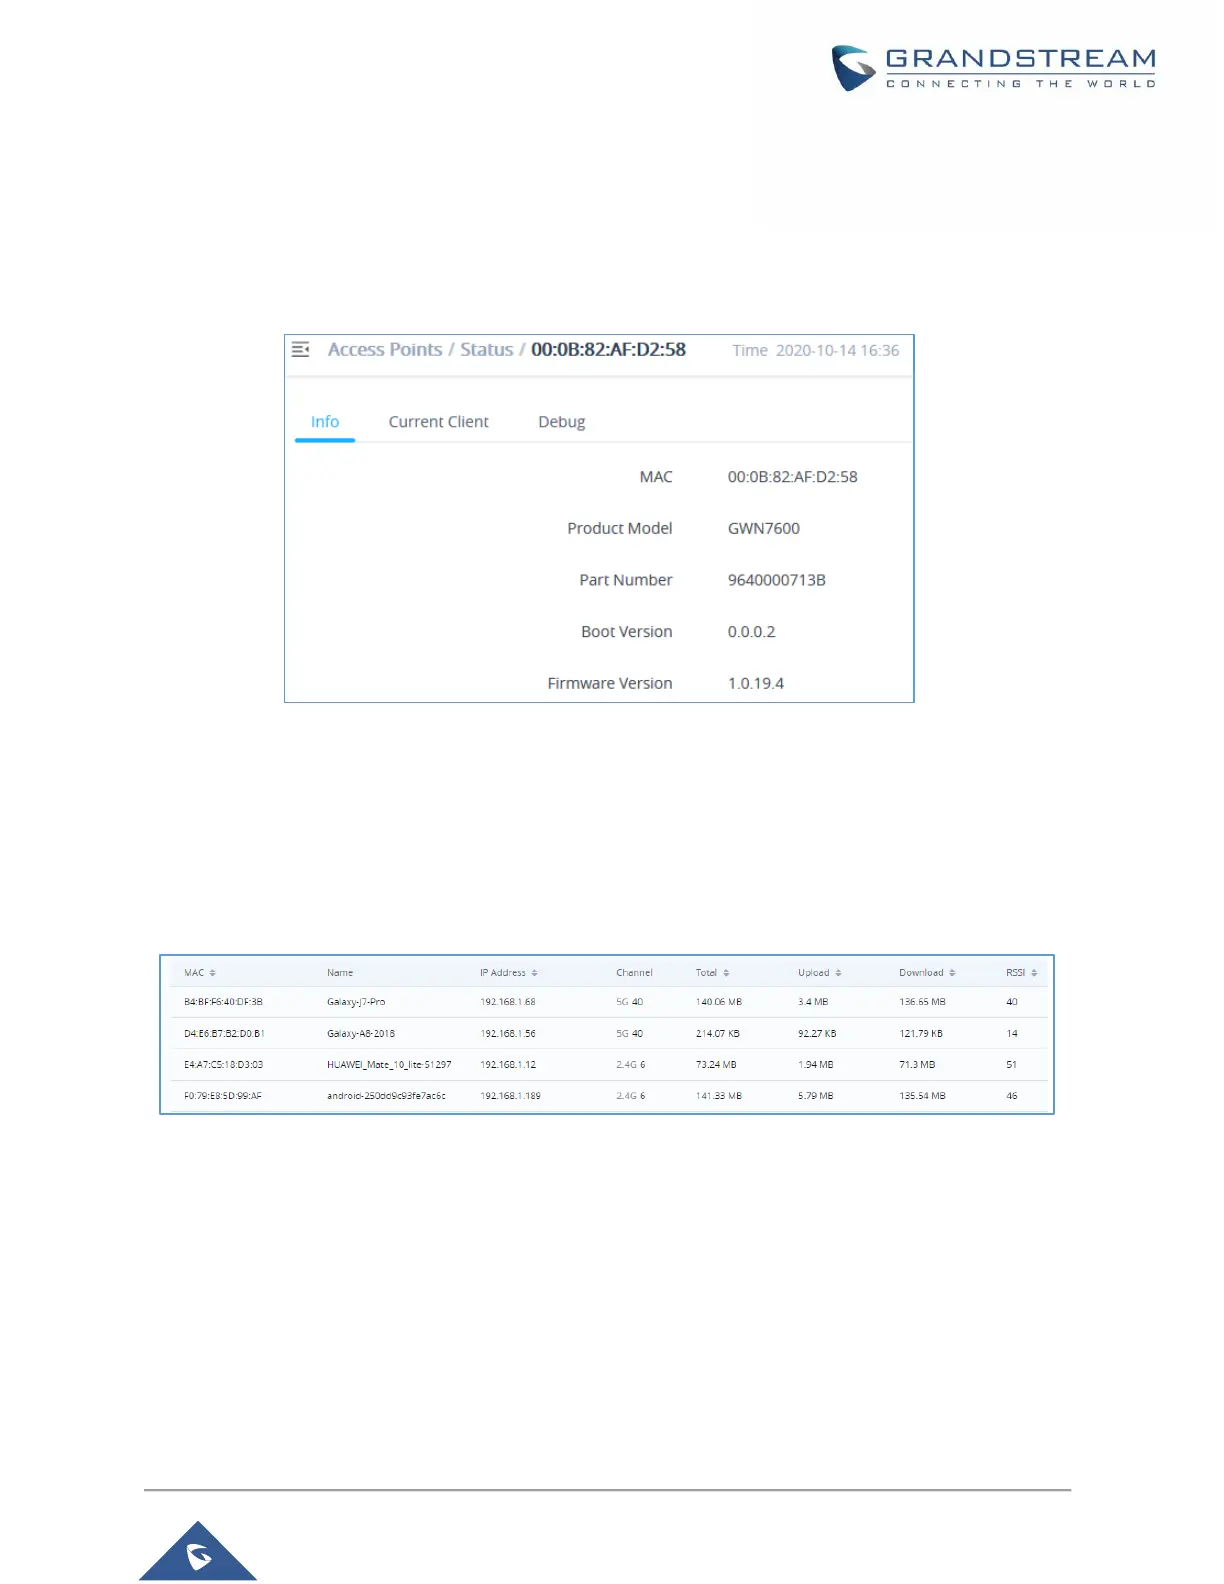
The tab “Info” above shows detailed information about the select AP, such as the model, name, firmware
version, memory used…etc.
Figure 49: Info
The first tab will display the data usage for the specified access point and allows the user to filter the traffic
graph for the last 2hours, 1day, 1week or 1 month. Also, the user has the ability to visualize the data usage
(Upload/Download) for all SSIDs broadcasted by the AP or select a specific SSID from the drop-down list.
Click on Current clients to see the currently connected clients to the select AP as shown on the figure
below.
Figure 50: Current Clients - Stats per AP
The last Tab is used by administrator for debugging purposes and provides the following tools:
Ping/Traceroute tools, such as the ping utility, traceroute tool.
One Key Debugging, to capture Wireless, Portal or Mesh traffic and logs will be found in Core
Files.
Core Files, when a crash event happens on the unit, it will automatically generate a coredump
file that can used by engineering team for debugging purposes.

 Loading...