Chapter 5 – General Operation
Honeywell Confidential: Use or disclosure of information on this page is subject to the restrictions on the title page.
13841 Rev A
196
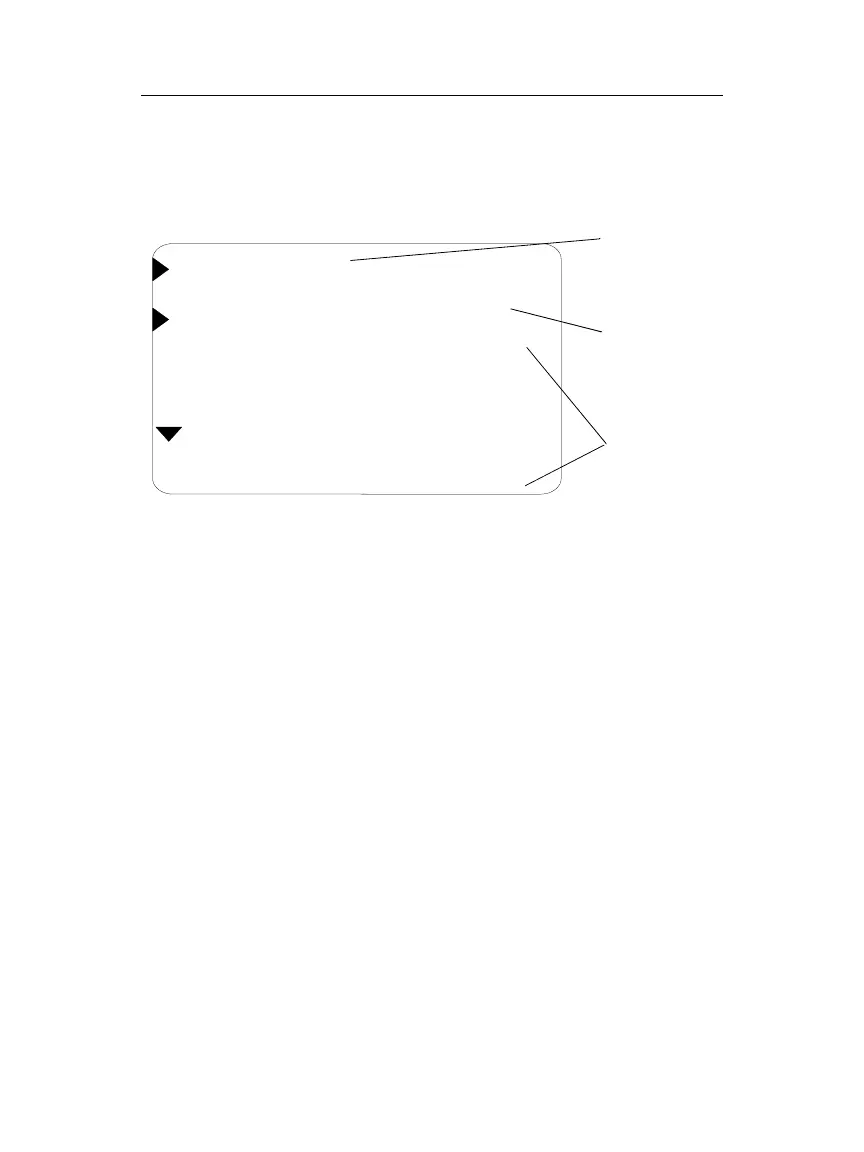
on the screen display. This action displays the Spectrum Orders
screen (see below).
If a one-per-revolution pulse was available during a spectrum
acquisition, the number of orders that fit in the preselected RPM
range display (regardless of whether they had any associated IPS
value).
After the user has viewed a list, press START again to save the
list in memory. The user may press GO BACK to erase the list.
5.8.4 Spectrum Viewer Feature
The Vibrex 2000 Plus allows the user to view spectral graph
plots of vibration data. Use the SPECTRUM ANALYSIS option
in the Main Menu screen to access this feature.
NOTE: This feature is only available with the Vibrex 2000
Plus system.
[ANNOTATE ] LIST 1
25SEP96 09:56:46 1A
<ORDER @ 500 PM>
0.5 0.00 IPS
1.0 0.86 IPS
1.5 0.01 IPS
2.0 0.00 IPS
2.5 0.01 IPS
USE TO ENTER
NOTES TO
ONE’S SELF
ONE
 Loading...