Getting Started on Programming the HP 4155A/4156A
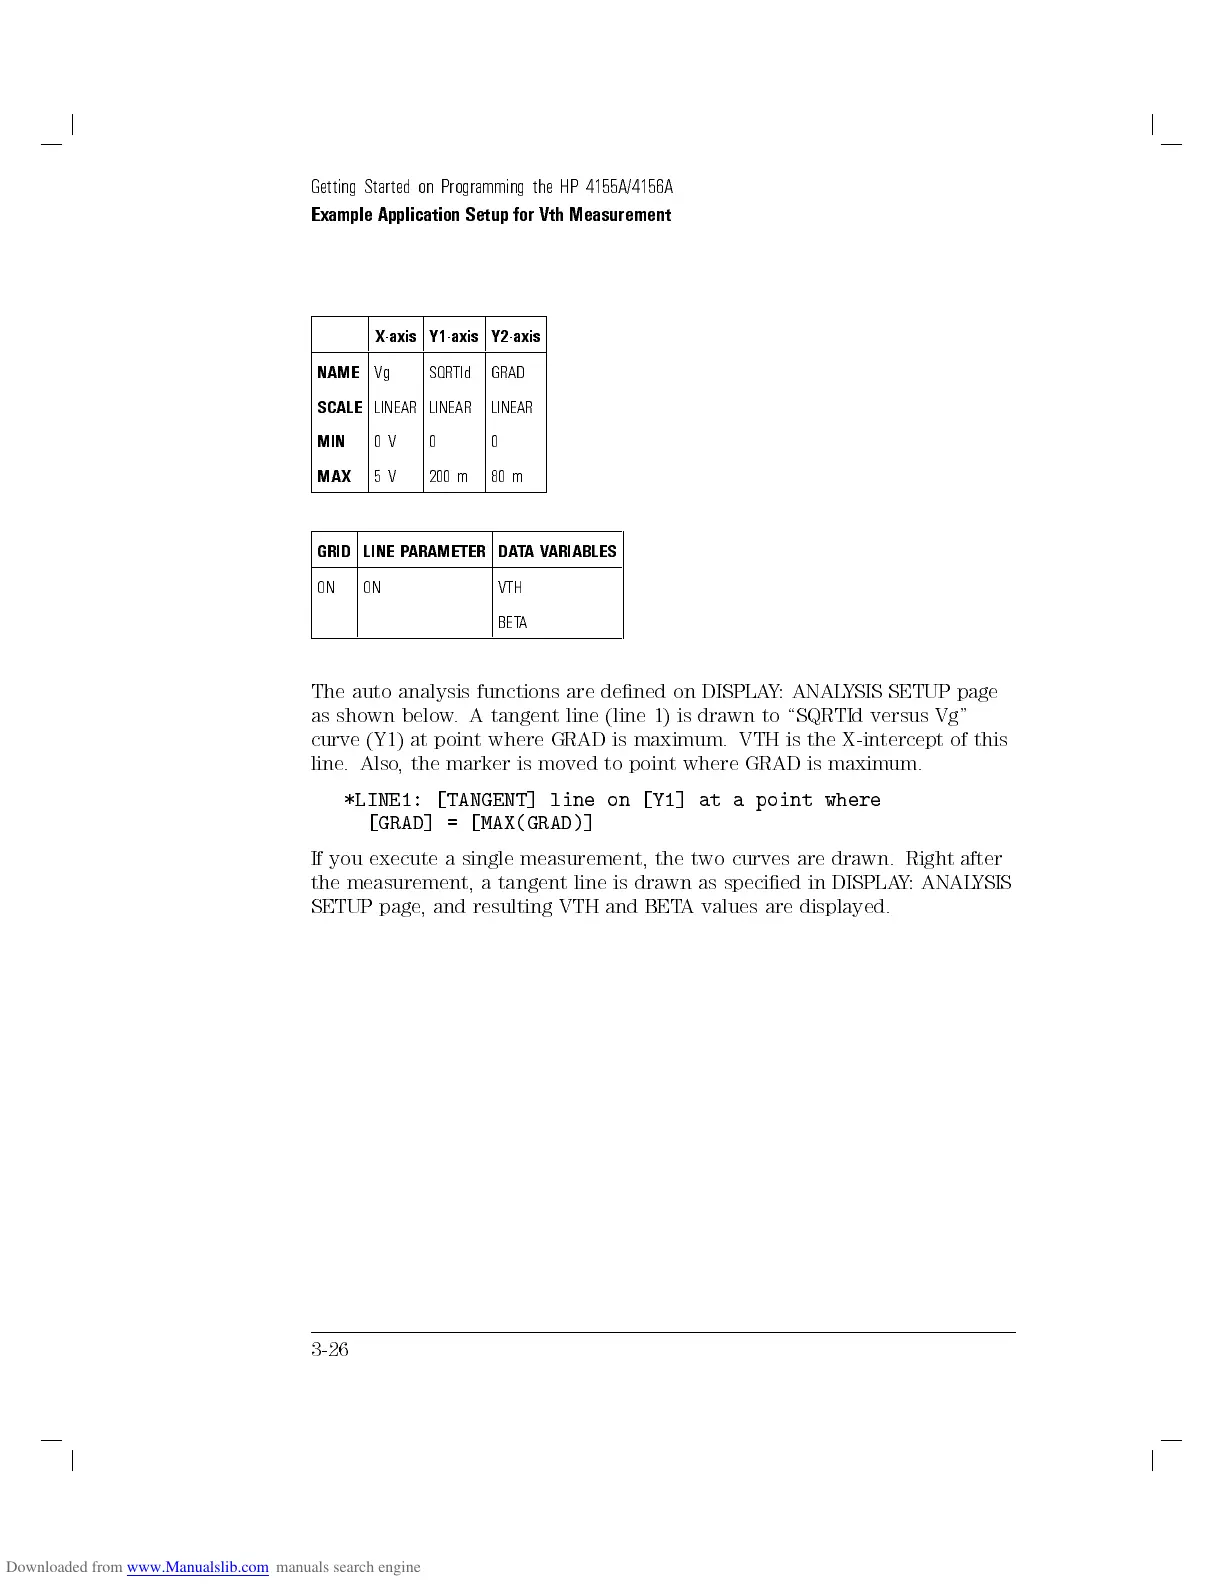
Example Application Setup for Vth Measurement
X-axis Y1-axis Y2-axis
NAME
Vg SQRTId GRAD
SCALE
LINEAR LINEAR LINEAR
MIN
0V 0 0
MAX
5V 200 m 80 m
GRID LINE PARAMETER DATAVARIABLES
ON ON VTH
BETA
The auto analysis functions are dened on DISPLAY: ANALYSIS SETUP page
as shown below. A tangent line (line 1) is drawn to \SQRTId versus Vg"
curve (Y1) at point where GRAD is maximum. VTH is the X-intercept of this
line. Also, the marker is moved to point where GRAD is maximum.
*LINE1: [TANGENT] line on [Y1] at a point where
[GRAD] = [MAX(GRAD)]
If you execute a single measurement, the two curves are drawn. Right after
the measurement, a tangent line is drawn as specied in DISPLA
Y: ANALYSIS
SETUP page, and resulting VTH and BETA values are displayed.
3-26
 Loading...