Keysight B2900 User’s Guide, Edition 5 4-19
Front Panel Reference
Display and Assist Keys
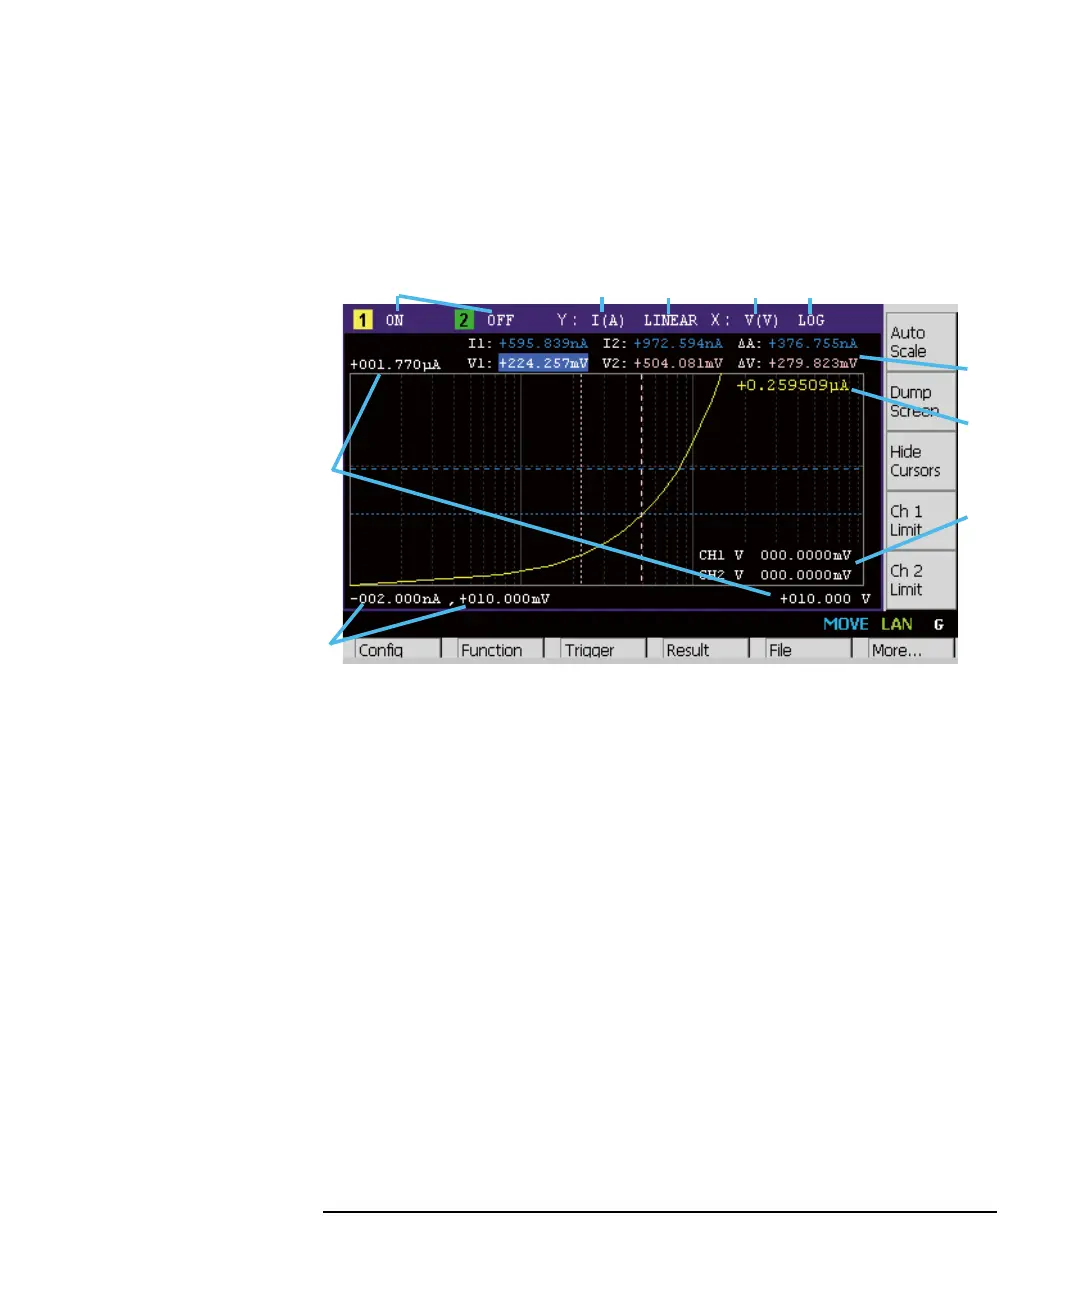
Graph View
Displays the graph for plotting the channel 1 and/or 2 measurement or math result.
The Graph view can plot up to 5000 data.
Display area 1. Graph display status ON or OFF. Only on 2-channel models. [n] is for channel n.
2. Y-axis data type I (A), V (V), R (), P (W), or MATH (see Table 4-2)
3. Y-axis scale LINEAR or LOG
4. X-axis data type I (A), V (V), R (), P (W), MATH, t (s), V1, or V2 (see Table
4-2)
5. X-axis scale LINEAR or LOG
6. Graph maximum value
7. Graph minimum value
8. Channel 1 and/or 2 source output value, limit value, or none (controlled by the
Ch n Source, Ch n Limit, or Hide Ch n assist key)
9. Channel 1 and/or 2 Y-axis data at the active X-cursor position. ----.---- is
displayed for the no-data position.
10. Cursor data (controlled by the Show Cursors or Hide Cursors assist key)
First line Positions and distance (e.g. I1, I2, A) of Y-cursors 1 and 2
Second line Positions and distance (e.g. t1, t2, t) of X-cursors 1 and 2